Effect of temperature on biological dose rates derived from spectral solar UV irradiance measurements.
| Trond Morten Thorseth*,
Berit Kjeldstad and Christer Jensen Norwegian
University of Science and Technology, Department of
Physics, N-7034 Trondheim, Norway. |
| ABSTRACT Accurate spectral solar irradiance measurements depend upon a good calibration. If the spectroradiometer operates at a different temperature than the calibration temperature, sensitivity and wavelength setting of the instrument will change. This is the case for most spectroradiometers, but the magnitude of this effect will vary for different types of instruments. In this study a widely used spectroradiometer, Optronic OL752, from Optronic Laboratories Inc. has been investigated. Both the effect of temperature on sensitivity and wavelength shift has been quantified. The sensitivity of the Optronic OL752 in the ultraviolet region, 290-400 nm, decreased approximately 0.8 %/K when the instrument was heated above the calibration temperature. Wavelength shift coefficients were derived for several wavelength regions with two independent methods. One of the methods used was direct observation of how the measured spectral lines from a Hg lamp, shifted with temperature. The other method, calculated the relative shift in the spectral global irradiance measurements by comparing the Fraunhofer structure in the measured spectra to the structure in an extraterrestrial spectrum. OL752 had a systematic wavelength shift, varying from 0.10 nm/K at 254 nm to 0.06 nm/K at 633 nm. CIE-weighted irradiance derived from modeled data, was used to estimate errors due to temperature effects. If the spectroradiometer temperature is not controlled, a change of 5 K may lead to an error in the derived CIE-weighted irradiance from 10% to 15% dependent upon solar zenith angle and atmospheric conditions. INTRODUCTION The knowledge about decreased global total atmospheric ozone (1)(2)(3) and the consequences of increased UV radiation (4)(5) have caused a need to measure solar UV radiation accurately. Many countries have establish UV networks, monitoring solar UV irradiation continuously, either with spectroradiometers, broadband meters or multichannel instruments (6). There has been an increased number of field experiments in which the effects of increased UV have been investigated on different biological systems (7) and there is a need to establish UV-dose rates. Accurate measurements of UV are complicated and the overall uncertainty can be due to several factors (8). One of these factors is the ambient temperature. It is well known that the instrument response changes with temperature, both spectroradiometers (9)(10)(11) , broadband instruments (12) and narrow channel instruments (13). To avoid the effect of fluctuating temperatures, many UV monitoring instruments are temperature stabilized (14) or the effect is taken into account in the measuring procedure in different ways (15)(16). If the effects of temperature changes are not taken into account or the temperature control fails, temperature dependent error will be introduced in the UV irradiance measurements. For most spectroradiometers both the wavelength calibration and the sensitivity calibration are temperature dependent. The calibration should be performed at the same temperature as the measurements are done. For non-temperature controlled spectroradiometers this is not always possible. During field experiments, the temperature might change several degrees, and the uncertainty in the UV irradiance will increase accordingly. The aim of the present paper is to quantify the error introduced in solar spectral UV measurements, when the spectroradiometer temperature fluctuates. This is done for a frequently used spectroradiometer, Optronic OL752. Wavelength dependent temperature coefficients will be derived for wavelength shift and sensitivity. Biological dose rates can be
derived from spectral solar irradiance spectra, when the
biological action spectrum is known. The uncertainty in
biological dose rates will depend both on the irradiance
measurements and the action spectrum. The CIE reference
action spectrum for ultraviolet induced erythema in
human skin, is a standardized action spectrum proposed by
the International Commission on Illumination (CIE) (17).
The uncertainty in the CIE weighted irradiance, due to
temperature induced errors in the measured solar
irradiance spectra, will be examined. Instrumentation The spectroradiometer
investigated was an Optronic model 752 (Optronic
Laboratories, Orlando, FL, USA). The instrument has been
used for three years to measure solar UV radiation on a
frequent basis. Component part of the instrument is a
double monochromator, focal length 100 mm, F number 4,
two concave holographic gratings 1200 lines/mm and a
photomultiplier detector (PMT), S-20, cooled relative to
the surrounding temperature. The temperature of the
PMT was approximately 14K below the
temperature of the monochromator. The entrance optics
used was a 1 m. quartz fiber and a teflon cosine diffuser
(Bentham Instruments, Reading, UK). The combination of
slits used gave a full width half maximum (FWHM) value of
1.0 nm. Instrument sensitivity was measured at different temperatures, ranging from 20°C to 35°C. The temperature was raised in steps of 5K and at each level, the instrument was kept stable for three hours to allow all gradients inside the monochromator to stabilize. The instrument was wavelength calibrated at each temperature level, when completely stabilized. Sensitivity was tested against a stable light source, a quartz halogen lamp (1000W FEL). The lamp current was supplied by a power supply from Eppley Laboratories. An additional home made current control unit in parallel with the lamp circuit compensated for any drift in the current. Lamp current was adjusted automatically each second and kept stable within 0.2 mA at 7.900 A. Lamp voltage was stable within 0.03%. The distance between lamp and diffuser was kept constant. Measurements of the emission spectrum, from 290 - 400 nm, was repeated ten times at each temperature level. The relative response change as a function of temperature was found. Wavelength shift Two different methods were used
to quantify the wavelength shift. One of the
methods was measurements of a Hg lamp in the
laboratory with different instrument temperatures.
Wavelength calibration was performed at 21 °C.
Temperature was increased in steps of 2.5 K from 20
°C up to 33 °C and as a control, lowered to 25° C and
20°C. Four lines of the lamp (296.7 nm, 312.9 nm, 365.0
nm, 404.7 nm) were scanned from 2 nm below to 2 nm above
the maximum with 0.1 nm resolution, totally 102 spectra.
The monochromator was operated in a normal horizontal
position and not moved during the experiment. Room
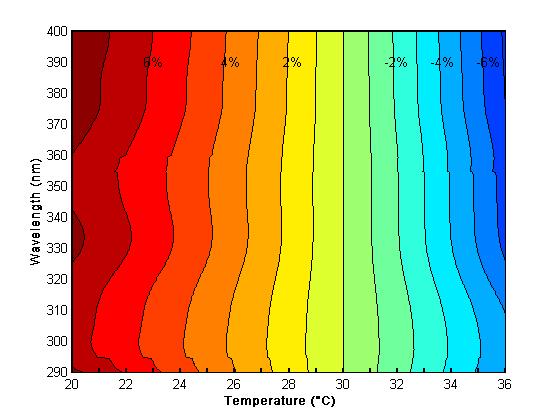
temperature was kept constant. A modified version of the PSEUDO SPHERICAL UVSPEC (21) model, based on discrete ordinate method (22), was used to create spectra for clear sky conditions. UVSPEC was modified to create a set of high resolution (0.05 nm resolution) ground level spectra with a method, outlined by Mayer et. al. (23). The ground albedo was set to 10%, ozone level at 340 DU, visibility to 120 km and cloud free conditions were used. Atlas3 extraterrestrial spectrum was used to calculate the spectrum from the transmission calculations. Spectra from 0° to 90° zenith were calculated and convoluted with a real slit function to give an simulated measured high resolution ground level spectrum. A systematic wavelength shift, Dl, was introduced in the modeled spectra, where the shift was assumed constant for all wavelengths. The error caused by sensitivity change was added, using the modeled sensitivity curves as a function of temperature directly. RESULTS. Sensitivity Our Optronic OL752 is normally operated and calibrated at 30°C. This temperature was chosen as the reference temperature in this study. The temperature dependent sensitivity change was slightly wavelength dependent. The sensitivity, S, was 7.2% higher at 20°C than the reference, at 25 °C 3.8% higher and at 35 °C 5.1% lower, where the values were averaged over wavelength. S(l) was fitted to a model given by:
where T is the
temperature in °C. The deviation in sensitivity from the
reference temperature (30 °C) were calculated from this
model. Fig. 1 shows the percentage deviation in
sensitivity where each contour line represents one
percent change in sensitivity relative to the reference
temperature. Noise due to fluctuations in the dark
current during one scan, was averaged out for all
wavelengths. This was done by using wavelength running
means of s0(l), s1(l) and s2(l). An average sensitivity change in the
ultraviolet region from 290 to 400 nm was approximately
-0.8 %/K, within the temperature range tested.
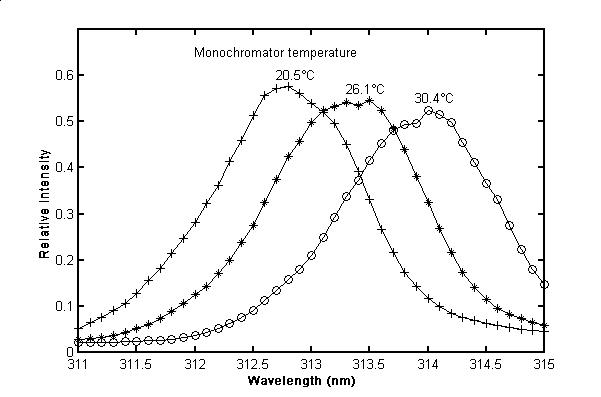
Wavelength shift, Hg lamp The emission lines
from a Hg lamp were measured continuously while the
instrument was heated from 20° to 33°C and cooled
down back to the starting temperature. The three lines in
the 312.9 nm region, will be observed as one single line
with a 1.0 nm bandwidth (FWHM) slit function. In Fig. 2
the measured emission spectra are shown for three
different spectroradiometer temperatures.
As the temperature increased,
the position of the wavelength with maximum intensity, lmax
was shifted towards higher wavelengths. This means that
the instrument measured radiation at a lower wavelength,
than the setting of the monochromator indicated.
This was defined as a positive wavelength shift. lmax was
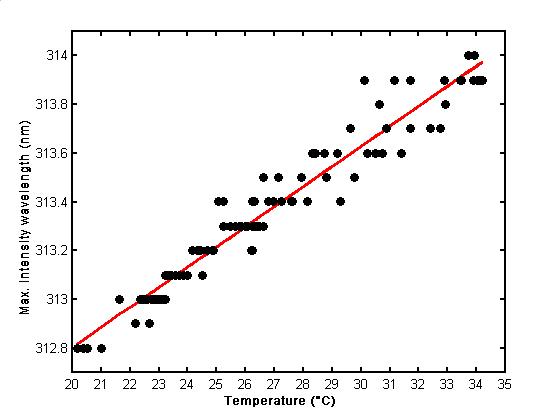
found in each emission spectrum. The results for the
312.9 nm triplet are shown in Fig. 3 where lmax is
plotted against temperature. There is a strong
correlation (R=0.97) between the change in lmax and
the spectroradiometer temperature. A slight decrease in
intensity due to a reduced sensitivity could be observed
as the temperature increased (Fig. 2).
When the temperature was lowered from 33°C and back to 20°C, the wavelength shift was reversed and the maximum wavelength was found at the same position as before. lmax was fitted to a linear curve lmax =a+bT by least squares method, where T is the temperature in °C and b is the temperature coefficient, which quantify the wavelength shift caused by temperature change. Similar temperature coefficients were determined from the other Hg lines (Table 1). |
Wavelength shift, solar spectrum Comparison of measured ground based solar
spectra and an extraterrestrial spectrum indicated a
similar temperature dependent wavelength shift in the
instrument. If the instrument shows a positive shift of
0.1 nm, the extraterrestrial spectrum must be shifted
-0.1 nm to be able to find the best matching Fraunhofer
structure. A wavelength shift algorithm will indicate a
shift of -0.1 nm. All spectral
shifts from the wavelength shift algorithm were
multiplied with -1 to give the same definition of shift
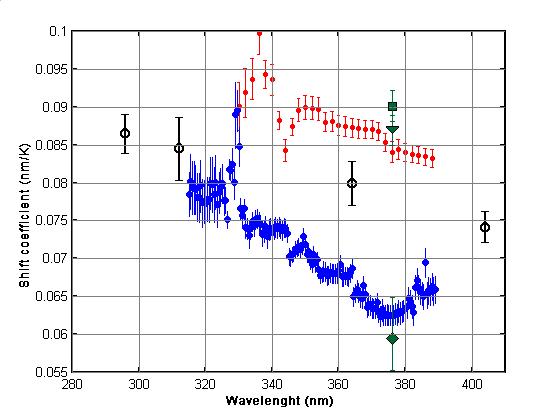
coefficients as in the laboratory experiment. Fig. 4 shows this wavelength shift at 376
nm as a function of temperature. There was a strong
correlation between wavelength shift and temperature
(R=0.99). Shift coefficients could be determined with
regression. The temperature coefficient determined for
the entire temperature range was 0.084±0.001 nm/K ( Fig.
4, red line). There was a slight change of slope in the
wavelength shift, when the temperature passed above 28
°C (Fig. 4). The coefficient determined for temperatures
between 28°C and 33°C (Fig. 4, blue line) was
0.065±0.004 nm/K and for 20 °C to 30 °C
the temperature coefficient was 0.09±0.002
nm/K.
Temperature coefficients were
derived for the whole wavelength range for global
irradiance measurements with 2 nm scan resolution and
with 0.5 nm scan resolution. Fig. 5 summarizes
temperature coefficients found from the mercury lamp in
the temperature range 20-30°C
For the highest temperature
interval investigated (Fig. 5 CIE
weighted irradiance
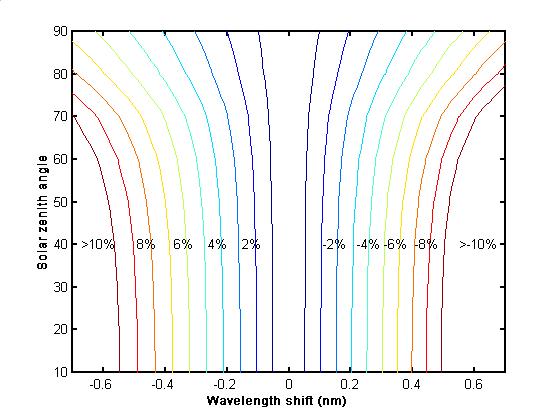
A wavelength shift towards shorter wavelengths (negative shift) which occurred when the instrument was operated at a lower temperature than the calibration temperature, would give too high CIE weighted irradiance. A shift of -0.2 nm, will result in an overestimation of the CIE-weighted irradiance of 3-4%, dependent on the solar zenith angle (Fig. 6). If the instrument temperature increases above the calibration temperature, a positive wavelength shift will occur and the CIE weighted irradiance will be underestimated. The error became less pronounced when the solar elevation was low (solar zenith angles > 65 degrees). When the
temperature of the instrument deviates from the
calibration temperature, two kinds of errors occur,
caused by wavelength shift and change in sensitivity.
These two errors was assumed additive. To quantify the
uncertainty in CIE weighted irradiance due to temperature
changes, both the wavelength shift coefficients and the
sensitivity coefficients were applied to modeled clear
sky spectrum. An averaged wavelength shift coefficient of
0.08 nm /K was used for all wavelengths and independent
of temperature range. Sensitivity change was calculated
using the fitted sensitivity model (Fig. 1) . Both
wavelength shift and sensitivity changes were introduced
in clear sky spectra, and the error in the CIE weighted
irradiance was calculated for temperature changes in the
range from 20°C to 35°C. Fig. 7 shows the total
error in the CIE weighted irradiance when the temperature
changes from the calibration temperature of 30°C.
Contribution from the wavelength shift error and the
sensitivity error can be seen. The example in Fig. 7
gives the error for clear sky conditions, solar zenith
angle of 40° and ozone at 340 DU. |

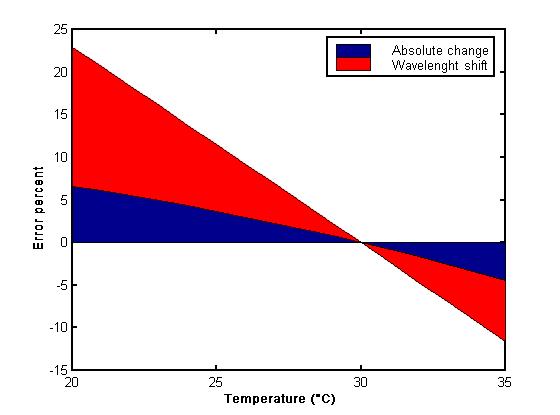
The estimated error in the CIE weighted irradiance obtained when the spectroradiometer operates at 20°C rather than 30°C was more than 20 %. A temperature change from a calibration temperature at 20°C have the same induced error in the CIE-weighted irradiance from a wavelength shift. The error caused by change in the absolute sensitivity will decrease because of the nonlinear decrease in sensitivity (See Fig. 1). Fluctuations from a stabilization temperature at 20°C gives lower total error pr degree change than a stabilization at higher temperatures. |
| DISCUSSION The decreased instrument sensitivity observed, as the temperature of the spectroradiometer increases (average -0.8 %/K), is in agreement with properties found in other spectroradiometers (24) The change in sensitivity correlated both with the temperature change inside the monochromator and at the photomultiplier tube (R=-0.992). It is known in other spectroradiometers that temperature influences the filter transmition (10). We are not able to distinguish whether the effect is caused by filters or the PMT from this experiment, due to strong correlation between monochromator temperature and PMT temperature. The effects are not caused by increased dark current, which increases exponentially with the PMT temperature, because every spectrum is corrected for dark current. For non-temperature stabilized spectroradiometers operating at different temperatures, a set of calibration curves, valid within a certain temperature range, should be available. If the relation between sensitivity and temperature is known for one instrument, only one calibration curve is needed. The effect of the temperature changes can be taken into account when the data are calibrated. Changes in the instrument sensitivity can be observed with a portable lamp unit, for instance the gain-check lamp that Optronic provides. The uncertainty of these lamps are at least 5% or more (25) but temperature drops of more than five degrees should be detectable. Temperature properties of the material used in the monochromator and the design of the optics within the monochromator is important for the wavelength stability of the instrument. The two gratings in the OL752 double monochromator are directly connected with a rod and some miss alignment of the gratings might occur as the temperature changes within the monochromator. This is a problem for all spectroradiometers using gratings. However, the magnitude of these effects will be more instrument specific. Both the design of the monochromator, focal length and properties of the gratings and the materials will influence. In the OL752 the wavelength shifted with temperature in a biphasic way. A different temperature coefficient could be found in the lower part of the temperature range (17 °C to 28 °C), compared with the higher interval (28 °C - 33 °C) (Fig. 4) for the whole wavelength range (Fig. 5). We do not know the reason for this. There is a time delay between when the air inside the monochromator has come to a stable temperature and when all the parts of the instrument have done the same. However such effects should show up as a hysteresis effect when the instrument is heated and lowered back in temperatures. During this time period temperature gradients might occur within the spectroradiometer. Even if the temperature nearby the monochromator chassis was monitored and found stable (as in our experiments), there might still be temperature gradients within instrument that is very difficult to detect and will influence the results. This might be the explanation why the temperature coefficients found from the Mercury lamp experiments done in the laboratory deviates slightly from those found with from solar irradiance measurements performed outdoors. Independent of the uncertainty in the absolute level of the shift coefficients, there is a very clear wavelength dependence (Fig. 5). Emission spectra of the Mercury lamp showed the wavelength shifts in the range from 250 nm to 632 nm. The spectral fine structure that were determined from the solar irradiance spectra (Fig. 5, blue and red points), are probably more due to the method used, rather than a real instrument effect. As an example; it is known that the KittPeak spectrum, used as a reference spectrum for the determination of the wavelength shift coefficients, give some problems in the 325-330 nm region (26). This causes some of the strange fluctuations in the shift coefficients derived from this spectrum. For the 0.5 nm resolution scans (Fig. 5, blue points) this cause a strange behavior up to 338 nm, while the same effect influences the results up to 348 nm in the shift determined from the 2 nm resolution data, due to the method used. For wavelengths below 325 nm ozone absorption will influence the Fraunhofer structure and cause a systematic underestimation of the wavelength shift. The effect of ozone has not been removed in the data analysis. At low solar elevations (solar zenith angels larger than 70°), the ozone effect becomes more pronounced. This is the main reason why the 95% confidence intervals are larger for wavelengths below 325 nm. The relative errors in the measured solar spectra, caused by wavelength shift, are most serious for shorter wavelengths. The error introduced in the CIE weighted irradiance will depend on the relative shape of the spectrum. This effect was illustrated best will modeled spectra (Fig. 6) where the shift coefficient of the Optronic was applied. The estimated error caused by wavelength shifts (Fig. 6) were in agreement with measured spectra (data not shown). These error estimates will depend upon the ozone concentration. For lower ozone concentrations than 340 DU larger errors will occur. Choosing another action spectrum with a steeper slope than the CIE, for instance the DNA action spectrum, are more sensitive to wavelength shifts and the estimated errors in the biological dose rates will be larger. To confirm the total error estimates with measured
spectra is not an easy experiments, because very stable
atmospheric conditions are needed over a long term.
Temperature stabilization of the instrument is very time
consuming and measurements should be done at a variety of
solar zenith angles. Not good enough data were available
to experimentally confirm the assumption that errors due
to wavelength shift and sensitivity were independent of
each other and to confirm the estimated total error in
CIE-weighted irradiance due
to temperature changes. For a
spectroradiometer used without a temperature control
unit, which is the case for most instruments used
in biological field experiments, one can of course
eliminate the wavelength shift error by doing wavelength
calibration before each scan. This is recommended.
The change in sensitivity can be compensated as long
as the temperature change is known and suitable
calibration curves are used. In field experiments
where the UV doses should be estimated within 10-20
percent, the effect of temperature should be taken into
account. The OL752 model shows an
excellent behavior at stabile temperatures. The
wavelength accuracy of ±0.1 nm can only be achieved when
the temperature of the monochromator is stabilized at a
given level with an accuracy of ±0.5 degrees. Acknowledgments This research has been funded by the Norwegian Science Foundation and the European Environmental program SUVDAMA. Anders Johnsson is acknowledged for fruitful comments to the manuscript. NSO/Kitt Peak FTS data used here were produced by NSF/NOAO. For further information contact: fhill@noao.edu (internet) 5/15/95 - F. Hill References |
| (1) Bojkov,R.D., L. Bishop
and V.E. Filetov (1995), Total ozone trends from
quality-controlled ground-based data (1964-1994) ,
Journal of Geophysical Research, Vol. 100, No. D12, pp.
25,867-25,876 (2) Bojkov.R.D, V.E Fioletov., D.S. Balis, C.S. Zerefos , T.V Kadygrova and A.M. Shalamajansky (1996) Further ozone decline during the northern hemisphere winter-spring of 1994-1995 and the new record low ozone over Siberia. Geophysical Research Letters Vol. 22 No. 20, pp. 2729-2732 (3) Chandra S., C.
Varotsos and L.E. Flynn (1996) The mid-latitude total
ozone trends in the northern hemisphere, Geophysical
Research Letters Vol. 23, No. 5, pp. 555-558 (6) Diffey,B. (1996) Measurement and Trends of Terrestrial UVB Radiation in Europe. OEMF spa., Milano. ISBN 88-7076-174-6 (7) Caldwell,M.M., A.H.Teramura, M.Tevini, J.F.Bornmann, L.O.Bjorn and G.Kulandaivelu. (1995) Effects of increased solar ultraviolet radiation on terrestrial plants. Ambio, Vol. 24, No. 3, pp. 166-173, ISBN 951-697-412-0 (8) Josefsson,W.A.P. (1994) Monitoring ultraviolet radiation. In Environmental UV Photobiology (ed. A.R.Young) Plenum Press, New York, ISBN pp. 73-88 (9) Kostkowski,H.J. (1997) Reliable spectroradiometry. Spectroradiometry Consulting, Maryland, ISBN 0-9657713-0, pp.493-495. (10) Bais, A. F., C.S. Zerefos and C.T. McElroy (1996) Solar UVB measurements with the double- and single- monochromator Brewer ozone spectrophotometers. Geophysical Research Letters, Vol. 23. No. 8. pp. 833-836 (11) Gardiner B. G. and P. J. Kirsch ed. (1995) Setting standards for European ultraviolet spectroradiometers. Air pollution reseach report 53. European Commission, Report EUR 16153, ISBN 92-826-5405-2 (12) Blumthaler, M. and W.Ambach (1986) Messungen der Temperaturkoeffizienten des Robertson-Berger Sunburn Meters and des Eppley UV-radiometers. Arch.Met.Geoph.Biocl., Ser.B Vo. 36, pp. 357-363. (13) Takeshita S., M. Sasaki, T. Sakata, Y. Miyake and G.A. Zerlaut (1994) Uncertainty of the measurement of global UV-B irradiance using a narrow-band filter radiometer. Proceedings: The eight conference on atmospheric radiation, 23-28 January, Nashville; Published by the American Meteorological Society, Boston. pp. 199-201. (14) Bernhard G. (1997) Die Genauigkeit von Messungen der solaren UV-Globlstrahlunstärke bei verschiedenen Amosphärenbedinungen, Shriftenreihe des Fraunhofer-Instituts Atmpsphärische Umwltforchung. Band 47. ISBN 3-927548-98-7 (15) Forster P. M. de F., K. P.Shine, A.R. Webb (1995) Modeling Ultraviolet Radiation at the Earth's Surface. Part II. Model and Instrument Comparison., Journal of Applied Meteorology, Vol. 34 pp. 2426-2439 (16) Booth, C.R., T. B. Lucas , J.H. Morrow, C.S. Weiler and P.A. Penhale (1994) The United States National Science Foundation's polar network for monitoring ultraviolet radiation., Ultraviolet radiation in Antarctica: Measurements and biological effects, Antarctic research series. Vol. 62, pp. 17-37. (17) CIE (International Commission on Illumination) (1987) Research note. A reference action spectrum for ultraviolet induced erythema in human skin. CIE J.6, pp. 17-21 (18) Koskela T.
ed., NOGIC93 The Nordic
Intercomparison of ultraviolet and total ozone
instruments at Izańa from 24 October to 5 November 1993.
Final Report. Finish Meteorological Institute, Helsinki
1994 (20) Slaper H., H.A.J.M.
Reinen and M. Blumthaler and M. Huber and F. Fuik (1995)
Comparing ground-level spectrally resolved solar UV
measurements using various instruments: A technique
resolving effects of wavelength shift and slit width.
Geophysical research Letters. Vol. 20,pp. 2721-2724
(22) Stamnes K., C. S. Tsay, W. Wiscombe and K. Jayaweera (1988) Numerically Stable algorithm for discrete-ordinate method radiative transfer in multiple scattering and emitting layered media., Applied Optics Vol. 27 pp. 2502-2509 (23) B. Mayer, G.
Seckmeyer and A. Kylling., (1997) , Systematic long-term
comparison of spectral UV measurements and UVSPEC
modeling results. Journal of Geophysical Research, Vol.
102. No. D7. pp. 8755-8767. (25) NOGIC96 The
Nordic Intercomparison of ultraviolet and total ozone
instruments at Izańa from 8.-22. October 1996. Finnish
Meteorological Institute, to be published. |