INFORMATION PROVIDED BY 4TH DERIVATIVES OF HUMIC ACIDS UV-VISIBLE ABSORPTION SPECTRA
Joanna Miklewska, Department of Land Use and Rural Development, University of Agriculture, 70-466 Szczecin, Poland
1. Introduction |
Humic substances are macromolecular organic compounds with heterogenous monomers and heterogenous kinds of linkages formed by random events. Therefore a reproducible structure or exact structural formula are impossible in this case (Stevenson 1982, Kumada 1987, Ziechmann 1988, Saiz-Jimenez 1996). Various experimental techniques were applied in studies on humic substances, still their composition and chemical structure seem to be only statistically defined. One of widely applied yet often not fully utilized non degradative methods is UV and visible spectroscopy.
It is widely known that UV visible absorption spectra of soil humic acids are usually monotonously decreasing with increasing wavelength and thus difficult to interpret (Stevenson 1982, Kumada 1987). Various coefficients based on ratios of absorption at given wavelengths were often used in studies of humic substances (Chen et al. 1977, Sławiński et al. 1978, Kulchaev 1980, Sugahara et al. 1984, Baes and Bloom 1990, Wang et al. 1990, Amalfitano et al. 1995) . However they usually served merely as additional indexes characterizing humic materials (Choudhry 1981, Saiz-Jimenez 1996). Absorption spectra of humic acids (HAs) in the visible region seem to have been largely ignored because of their featureless character. But this very featurelessness is induced by the brown color of HAs, which is a part of their definition (Kumada 1965). Thus it seems reasonable to look for some structural information on humic acids hidden in their apparently featureless spectra. Presence of various organic moieties in the structure of humic acids should be reflected in their absorption spectra.
Transformation of monotonic absorption spectra of humic acids in their fourth derivatives results in apparent absorption bands, which reality has been proved with mathematical modeling elsewhere (Miklewska 1996). The method was earlier applied to resolve UV spectra of for example proteins (Siemenova and Saakov 1989). This paper presents a preliminary results of differentiation of UV visible absorption spectra of humic acids.
| 2. Materials and methods |
HAs extracted from A horizons of 12 black soils samples (BS-HAs) and of 12 rusty soils (RS-HAs) samples were investigated. The two types of soils were chosen because of appreciable differences in their genesis, morphology, and physic-chemical properties. The standard IHSS extraction method was used. After decalcitation with 0.1 M H2SO4 humic acids were extracted with 0.1 M NaOH and purified with the mixture of HF and HCl acids. Details of extraction procedure are given in Miklewska (1996). Elemental analysis (C, H, N, O) was performed on all HA samples. Elements atomic contents as well as atomic ratios and 'theoretical respiration coefficient' CQ after Kumada (1987) were computed resulting in 9 variables. Reduction of variables was achieved with main factors analysis. Factors' interpretation is that they are unmeasureable variables functionally connected with original measurable variables. The measure of original variables' contribution to given factor are correlation coefficients.
UV-visible absorption spectra of HAs were taken at pH=6 and at pH=10 in three replicates each. HA solutions with concentration 2.5 mg HA/ ml were prepared. UV and visible absorption spectra were recorded on Specord M-42 Karl Zeiss Jena equipped with interface for data transmission to IBM computer. Three ranges of recording spectra were applied because of computational convenience. All spectra were normalized to the same value (2.0) at the beginning of the range. Normalization was applied to allow comparisons because of unknown and variable particle mass of HAs. The set of absorption spectra was divided in 4 categories, 2 groups of HAs times 2 pH values, used in further statistical examination (Statistica 1994). Normalized absorption spectra are similar in groups and between groups, slight differences being easier seen in pH 10 (Figure 1).
| UV | VIS1 | VIS2 | |
| Black soils pH 6 |  |
 |
 |
| Rusty soils pH 6 |  |
 |
 |
| Black soils pH 10 |  |
 |
 |
| Rusty soils pH 10 |  |
 |
 |
Figure 1 UV visible absorption spectra of humic acids by
categories.
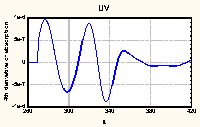
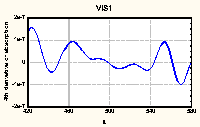
Derivatives of spectra were computed
numerically with specially dedicated program (Miklewska 1996).
After trials, 4th derivatives were chosen. The higher
the derivative the higher is resolution but the smaller are
absolute values and a noise enhances its contribution.
Differentiation of the monotonously decreasing spectra of HAs
leaded to well structured curves with easily observed maxima
(Figure 2). It was theoretically proved and experimentally
confirmed for many compounds that the position of maximum in even
derivatives of absorption spectra reflects their position in
original spectra (Rao 1975). However, the peak magnitudes in
derivative spectra do not directly reflect the intensity in
original spectra (Analytikum 1981). So, for compounds such
complicated as HAs the only valuable information is maxima
position so far.
 |
 |
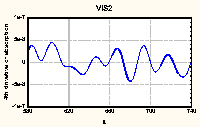 |
Figure 2. Fourth derivative of UV-VIS absorption spectrum
of HA No. 7
(average of 3 replications)
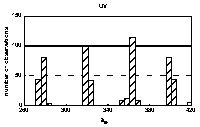
Position of maxima was numerically found for every 4th derivative spectrum and categorized histograms were constructed which allowed for setting boundaries of main absorption regions (Figure 3). Assumption was made that the regions define broad absorption bands reflecting absorption of some groups of chromophores (Staab 1962). By means of statistical comparison of group averages the bands were classified according to variability of maxima position against pH and preparates origin.
Interpretative value of the bands was evaluated on the basis of correlation coefficients between maximum absorption and the structure factors.
| 3. Results and discussion |
The high mutual correlation coefficients of elemental analysis data (Table 1) indicate that a proper way of their joint treatment is a factor analysis (Miklewska 1997).
Table 1 Correlation
coefficients among elemental analysis data
| N% | C% | H% | O% | C/O | C/N | O/H | C/H | CQa) | |
| B l a c k s o i l s | |||||||||
| N% | 1.00 | .42 | -.09 | -.75* | .56 | -.57 | -.52 | .28 | -.72* |
| C% | .42 | 1.00 | -.86* | -.65* | .93* | .50 | .16 | .97* | -.59* |
| H% | -.09 | -.86* | 1.00 | .19 | -.64* | -.71* | -.63* | -.96* | .13 |
| O% | -.75* | -.65* | .19 | 1.00 | -.86* | .15 | .64* | -.45 | .97* |
| C/O | .56 | .93* | -.64* | -.86* | 1.00 | .29 | -.18 | .83* | -.78* |
| C/N | -.57 | .50 | -.71* | .15 | .29 | 1.00 | .67* | .62* | .18 |
| O/H | -.52 | .16 | -.63* | .64* | -.18 | .67* | 1.00 | .39 | .67* |
| C/H | .28 | .97* | -.96* | -.45 | .83* | .62* | .39 | 1.00 | -.38 |
| CQa) | -.72* | -.59* | .13 | .97* | -.78* | .18 | .67* | -.38 | 1.00 |
| R u s t y s o i l s | |||||||||
| N% | 1.00 | -.84* | .74* | .17 | -.66* | -.99* | -.36 | -.81* | .29 |
| C% | -.84* | 1.00 | -.88* | -.37 | .89* | .84* | .31 | .98* | -.30 |
| H% | .74* | -.88* | 1.00 | -.10 | -.57 | -.79* | -.72* | -.96* | -.19 |
| O% | .17 | -.37 | -.10 | 1.00 | -.75* | -.09 | .76* | -.18 | .93* |
| C/O | -.66* | .89* | -.57 | -.75* | 1.00 | .63* | -.15 | .78* | -.64* |
| C/N | -.99* | .84* | -.79* | -.09 | .63* | 1.00 | .44 | .83* | -.20 |
| O/H | -.36 | .31 | -.72* | .76* | -.15 | .44 | 1.00 | .50 | .77* |
| C/H | -.81* | .98* | -.96* | -.18 | .78* | .83* | .50 | 1.00 | -.09 |
| CQa) | .29 | -.30 | -.19 | .93* | -.64* | -.20 | .77* | -.09 | 1.00 |
a) CQ = 4C/(4C+H-3N-2O) (Kumada 1987)
Extraction of main factors (Statistica 1994) resulted in the two main factors. Factor loadings (Table 2) show the function of which primary variables are the factors. So, F1 is a function F1 (C, H, C/N, C/H) for black soils HAs and a function F1 (N, C, H, C/N, C/H) for rusty soils HAs. Instead, F2 is a function F2 (N, O, O/H, CQ) for black soils HAs and a function F2 (O, O/H, CQ) for rusty soils HAs. Except for N, playing presumably different role in the structure of both groups of HAs, two extracted factors depend on the same original variables: 1st on C, H contents, and C/O, C/N, C/H ratios; and 2nd on O content, and O/H and CQ ratios. It seems plausible to interpret the factors as 'kernel structure' and 'reactivity', respectively (Miklewska 1997).
Table 2 Factor loadings for elemental analysis data:
|
HAs | RS - | HAs | ||||
| Factor F1 | Factor F2 | Factor F1 | Factor F2 | ||||
| %N | .03 | .87* | -.89* | .07 | |||
| %C | .89* | .44 | .95* | -.18 | |||
| %H | -.98* | .04 | -.91* | -.30 | |||
| %O | -.26 | -.95* | -.17 | .95* | |||
| C/O | .70* | .69 | .75* | -.59 | |||
| C/N | .79* | -.45 | .91* | .01 | |||
| C/H | .97* | .22 | .96* | .02 | |||
| O/H | .55 | -.78* | .47 | .86* | |||
| CQa) | -.20 | -.94* | -.15 | .94* | |||
| Explained variance | 4.23 | 4.07 | 5.12 | 3.02 | |||
| Explained variance % | 47% | 45% | 56.87% | 33.58% |
a) CQ = 4C/(4C+H-3N-2O), *
a<0.05, BS-HAs, RS-HAs: humic acids extracted from
black soils or rusty soils, respectively.
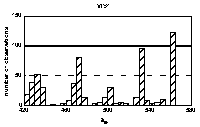
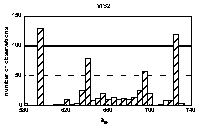
Histograms of maxima positions were prepared
separately for every of four groups of spectra. Absorption bands
specific for the HA origin and/or pH value as well as uniform
were identified in the histograms. By means of statistical
comparison of group averages and deviations for individual bands,
the bands were classified into 4 groups (Figure 3). The term
'constant' was used for unchanging with origin of HAs and the
term 'stable' for unchanging with pH.
 |
 |
 |
||||||||||||
| band: | u1 | u2 | u3 | u4 | v1 | v2 | v3 | v4 | v5 | w1 | w2 | w3 | w4 | w5 |
Figure 3 Histogram of bands' maxima positions. Bands' groups: constant and stable: u2, u4, v3, v5, w1, constant and unstable: v2, w3, inconstant and stable: u3, w4, w5, constant or not depending on pH: u1, v1, v4, w2.
The bands in the histogram are not of the same nature: some are sharp and intensive, indicating for well-defined maximum position and frequent occurrence, and some are broad and small. In general, sharpest and abundant bands occur in UV region. Moreover, some bands' positions correspond to wavelengths used before to define spectral ratios (Chen et al. 1977, Choudhry 1981, Gallot and Thomas 1993, Kulchaev 1980, Sławiński et al.1976, Stevenson 1982, Stevenson and Schnitzer 1984, Sugahara et al. 1984, Welte 1955). Some of the bands observed in 4th derivatives occured in areas previously reported in excitation fluorescence spectra (Miklewska et al. 1994).
An identification of the most relevant bands was based on correlation coefficients between absorption at wavelength of band' maximum and elemental composition described by main factors. The second factor revealed poor correlation with that absorption, but the first factor exhibited usually high significant correlation coefficients (Table 3).
Table 3. Correlation
coefficients of 1st factor with bands maxima' absorption by
categories:
| Band | BS-HAs pH6 | BS-HAs pH10 | RS-HAs pH6 | RS-HAs pH10 |
| u1 | 0.68* | 0.72* | 0.67 | 0.70* |
| u2 | 0.88* | 0.93* | 0.26 | 0.54 |
| u3 | 0.92* | 0.91* | 0.25 | 0.62* |
| u4 | 0.39 | 0.90* | 0.35 | 0.75* |
| v1 | 0.84* | 0.80* | 0.72* | 0.65* |
| v2 | 0.93* | 0.90* | 0.83* | 0.83* |
| v3 | 0.84* | 0.80* | 0.91* | 0.86* |
| v4 | 0.85* | 0.89* | 0.87* | 0.83* |
| v5 | 0.49 | 0.03 | 0.81* | 0.80* |
| w1 | 0.78* | 0.71* | 0.37 | 0.57 |
| w2 | 0.70* | 0.77* | 0.23 | 0.62 |
| w3 | 0.77* | 0.67* | 0.13 | 0.40 |
| w4 | 0.69* | 0.72* | 0.05 | 0.26 |
| w5 | 0.65* | 0.67* | 0.02 | 0.19 |
* a<0.05, BS-HAs, RS-HAs: humic acids extracted from black soils or rusty soils, respectively
In the near visible region (420 - 560 nm) the bands were well defined and significantly correlated with the structural factor of HAs. In the far visible region (600-740 nm) the bands beared some information only for BS - HAs. In the UV region usually pH10 was necessary for significant correlation has occurred. The only band of diagnostic value exclusively for RS-HAs occurred near 580 nm.
Because of large broadness of absorption bands, presumably related to statistical nature of humic substances, identification of chromophores in traditional meaning might be impossible. However, the absorption regions separated in the spectral range might be attributed to action of some groups of chromophores. Particular identifications were out of the scope of the present work, still in view of hitherto existing literature the three ranges may be separately described. Hypothesis is built on comparison of values of absorption coefficients of various moieties known to be present in HAs structure (Choudhry 1981).
In the UV region maximum absorption have m-polyphenyls, loge 5 and p-polyphenyls, loge 4.0 - 5.0 (Staab 1962). In the range of 4.0 to 5.0 is also loge for anthraquinones, naphthoquinones, benzoquinones (2nd band). Slightly lower (3.5 - 4.2) is loge for purine bases, which maximum absorption falls beneath 270 nm (Rao 1975).
In the VIS1 range, 420-580 nm, the maximal specific absorption of about 4.0 (loge) have some hydroquinones, phenylic-methylic cations and anions , and anthracene cation (Rao 1975). Many of hydroxy quinones and semiquinones have in this range bands with loge about or over 3.0 (Bors et al. 1975). Because of a large number of possible derivatives, absorption maxima derived from various chromophores cover all l values (Thomson 1971).
In the VIS2 range, 580-740 nm, the highest one is polyenes' absorption. Also many donor-acceptor complexes are absorbing in this range (Rao 1975). Processes of a charge transfer and the consequence of formation of e donor-acceptor complexes are typical for a system of humic substances (Ziechmann 1988). Considerable contribution of that complexes in visible absorption of humic substances was reported by Baes and Bloom (1990) and Wang et al. (1990).
4.Conclusions
Presented results confirmed that the spikes revealed in fourth derivatives of HAs absorption spectra have the real origin. Bands positions fitted well the earlier observed absorption maxima and previously applied absorption regions. Absorption bands specific for the HA origin and/or pH value as well as uniform were identified. Bands' absorption was significantly correlated with the 1st factor in a degree depending on band position, HA origin, and on pH value.
References
| 1. Amalfitano C., R.A.
Quezada, M.A. Wilson, J.V. Hanna, 1995, Chemical
composition of humic aids: a comparison with precursor
"light fraction" litter from different
vegetations using spectroscopic techniques. Soil Sci.159,
6, 391-401. 2. Analytikum, ed. K.Doerffel, R. Geyer, 1981, Ch.8: Mathematische Methoden in der Analytik. Leipzig, 491 pp. 3. Baes A. U., Bloom P. R., 1990, Fulvic acid ultraviolet-visible spectra: influence of solvent and pH, Soil Sci.Soc.Am.J. 54 (5), 1248-1254. 4. Bors W., M. Saran, C. Michel, E. Lengfelder, C. Fuchs, R. Spottl, 1975, Pulse-radiolytic investigations of catechols and catecholamines, I Adrenaline and andrenochrome, Int. J. Radiat. Biol. 28 (4), 353-371. 5. Chen Y., N. Senesi, M. Schnitzer, 1977, Information provided on humic substances by E4/E6 ratios, Soil Sci. Soc. Am. J. 41, 352-358. 6. Choudhry G.G., 1981, Humic substances: Photophysical, photochemical and free radical characteristics. Environ. Chem. 4, 261-295. 7. Gallot S., O.Thomas, 1993, Fast and easy interpretation of a set of absorption spectra: theory and qualitative applications for U.V. examination of waters and wastewaters, Fresenius J. Anal. Chem. 346, 976-983. 8. Kulchaev E. M., 1980, Electronic and vibrational absorption spectra of fulvic acid fractions, Chem. Abstracts, 93, No 148848. 9. Kumada K., 1965, Studies on the colour of humic acids. Part 1. On the concepts of humic substances and humification. Soil Sci. Plant Nutrition 11, 11-16. 10. Kumada K., 1987, Chemistry of soil organic matter, Japan Scientific Societies Press Tokyo, Elsevier, 241p. 11. Miklewska J., 1996, Zastosowanie analizy czwartych pochodnych widm absorpcji w zakresie UV-VIS do charakterystyki kwasów huminowych z czarnych ziem i gleb rdzawych [Application of analysis of 4th derivatives of UV visible absorption spectra to characterization of humic acids from black soils and from rusty soils]. Thesis, UMK Torun. 12. Miklewska J., 1997, A new insight at elemental analysis of humic acids - factor analysis approach. To be published in: Proceedings of 8th IHSS, Elsevier. 13. Miklewska J., D.Gołębiowska, H.Dziadowiec, 1994, Statistical Approach to the Differentiation of Fluorescence Spectra of Humic Acids against Age, w: Humic Substances in the Global Environment and Implications on Human Health, s.317-322, red. M. Senesi, T. M. Miano, Elsevier, Amsterdam. 14. Rao C.N.R., 1975, Ultra-violet and visible spectroscopy. Chemical applications. London - Butterworts, 242 pp 15. Saiz-Jimenez C., 1996, The chemical structure of humic substances: recent advances. [in]: A. Piccolo ed., Humic Substances in Terrestial Ecosystems, Elsevier, Amsterdam, 688 pp. Siemienova A.V., V.S. Saakov, 1989, Metod faktornogo eksperimenta kak sposob interpretacii proizvodnyh spektrov pri analizie nativnyh belkowych struktur. Fizjologia Rastenij 36, 6, 1207-1214. 16. Sławiński J., W. Puzyna, Sławińska D., 1978, Chemiluminescence in the photooxidation of humic acids. Photochem. Photobiol., 28, 75-81. 17. Staab H.A., 1962, Einfuhrung in die theoretische organische Chemie. Verlag Chemie, Weinheim. 18. Statistica, 1994, General Conventions and Statistics I, StatSoft, Inc., Tulsa. 19. Stevenson F. J., 1982, Humus Chemistry: Genesis, Composition, Reactions, Wiley-Interscience, New York, 443 pp. 20. Stevenson I. L., Schnitzer M., 1984, Energy-dispersive X-ray microanalysis of saturated fulvic acid -iron and -copper complexes. Soil Sci.138, (2), 123-126. 21. Sugahara K., S.Koga, A.Inoko, 1984, Color change of straw during composting, Soil Sci. Plant Nutr., 30, 163-173. 22. Thomson R. H., 1971, Naturally occuring quinones, 2nd Ed. Academic Press, London & New York, s. 39-92. 23. Wang, Z.D., Pant B.C.; Langford C.H., 1990, Spectroscopic and structural characterization of a Laurentian fulvic acid: notes on the origin of the color. Analytica Chimica Acta, 232(1), 43-49; 24. Welte E., 1955, Nuere Ergebnisse der Humusforschung, Angew. Chem. 67, p. 153-155. 25. Ziechman W., 1988, Evolution of structural models from consideration of physical and chemical properties, (w) Humic Substances and Their Role in the Environment, s.113-132, red. F.H. Frimmel i R.F. Christman, A Wiley - Interscience Publ., New York. |