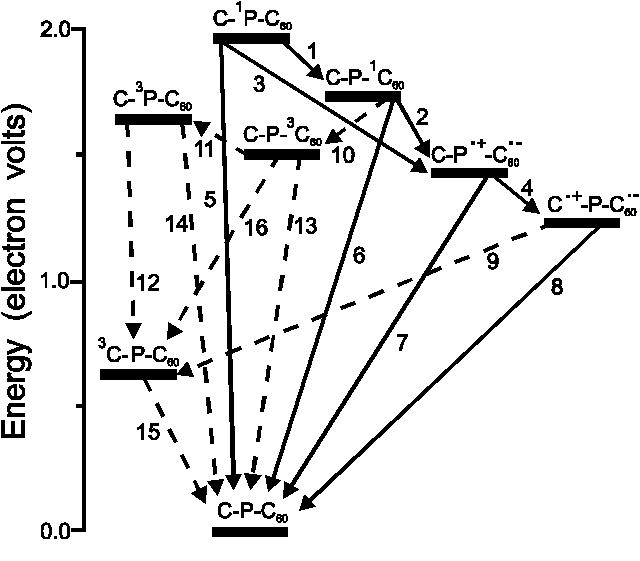
Figure 1. Energies of transient states of triad 1 and relevant interconversion pathways. The energies are based on spectroscopically or electrochemically determined measured or literature values for model compounds. The solid arrows indicate processes involving only singlet states and charge-separated states, whereas the dashed arrows identify interconversion processes involving triplet states.