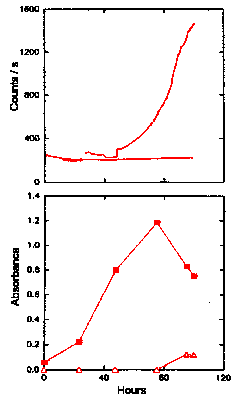
Figure 5 replicate
The Chemiluminescence and Oxidation of Linoleic Acid Catalysed by Glucose

The upper graph gives the time dependence of the CL intensity
observed from a solution (50 cm3, 2 mg cm-3 ) of linoleic acid when
undergoing oxidation in the presence of 20 mM glucose. The CL obtained in Fig. 4, without
any catalyst added, is also shown for comparison. The lower graph shows the UV absorbance
at 234 nm (filled symbols) of linoleic acid (25°C) oxidized by glucose, as an indication
of the formation of hydroperoxides. Also shown in the lower graph is the UV absorbance at
270-280 nm (unfilled symbols) of linoleic acid, as an indication of the formation of
secondary oxidation products. return to text
|

