Double logarithmic plot of laser fluorescence 1 intensity distribution (LFL1) vs. laser fluorescence 2 intensity distribution (LFL2)
 
                    Double log. plot of sideward scattering (LSS) 
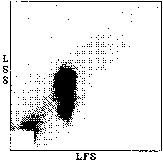
                    vs. forward scattering (LFS) 
 
  
Logarithmic plot of laser fluorescence 1 intensity distribution (LFL1) 
 
        Logarithmic plot of laser fluorescence 2 intensity distribution (LFL2)
 
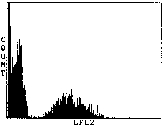
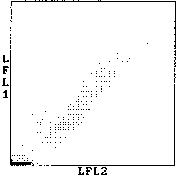
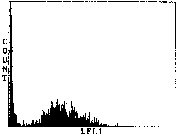
Fig. 3:  Flow cytometric analysis of CX1 cells incubated with mTHPC in fresh whole human blood (1:1 mixture).