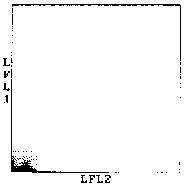
Double logarithmic plot of laser fluorescence 1 intensity distribution (LFL1) vs. laser fluorescence 2 intensity distribution (LFL2)
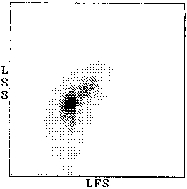
Double log. plot of sideward scattering (LSS)
vs. forward scattering (LFS)
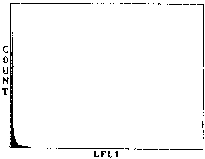
Logarithmic plot of laser fluorescence 1 intensity distribution (LFL1)
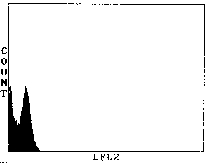
Logarithmic plot of laser fluorescence 2 intensity distribution (LFL2)
Fig. 1:
Flow cytometric analysis of fresh whole human blood.