| Site home page | Conference home page | Discussion |
TESTING OF THE PHOTOPOLYMERIZABLE PHOTORESISTS
Valeri M. Treushnikov, Elena A. Victorova
Reper NN, Ltd. ,
Gagarin Ave., 23, building 5, office 214. Nizhnii Novgorod, 603022, Russia
Phone: +7(8312)658096, Fax : +7(8312)645607
E-mail: reper@reper.ru; reper-nn@mail.ru
Three aspect of the photopolymerizable photoresist testing were studied. They are: (1) the correct determination of light sensitivity and resolution of the photoresist layers; (2) the problem of possible estimation of the internal parameters of the systems on the basis of determination their characteristic and sensitometric curves; (3) finding of the relationship between the light sensitivity and resolution of the layers and their composition and structural dynamical properties. Main requirements that must be imposed on the photoresist composition giving an opportunity to obtain maximal resolution are formulated.
Keywords: photochemical reaction. testing, light sensitivity, resolution, mathematical simulation, photopolymerizable composition
Two directions have originated in the field of photoresist sensitometry. The first one is connected with selection of some characteristic values giving an opportunity to predict the photoresist behavior in the lithographic process. Light sensitivity and contrast controlling energy dose desirable to form resist mask, and resolution of the resist are among the most important characteristics. Knowing of such values gives an opportunity to produce a relative evaluation of different photoresists due to technological parameters and has an interests to photoresist users first of all. Other direction is connected with a with to have a reason – consequence chain of the photoresist technological characteristics with its composition and dynamical properties of the structure.
Solution of such problems demands to elaborate an unique approach for photoresist testing based upon theories giving an opportunity to make an adequate description of resist relief forming in the course of a photolithography process. The general ideas of our approach were described elsewhere [1-4]. The aim of the present article to consider the said problem in the case of photopolymerizable photoresists (PPP). This class of photoresists has wide areas for applications in different fields of technology such as radiotechnology, microelectronics, printing, medicine etc. General information concerning composition of PPP and properties of their components could be found in [5-9].
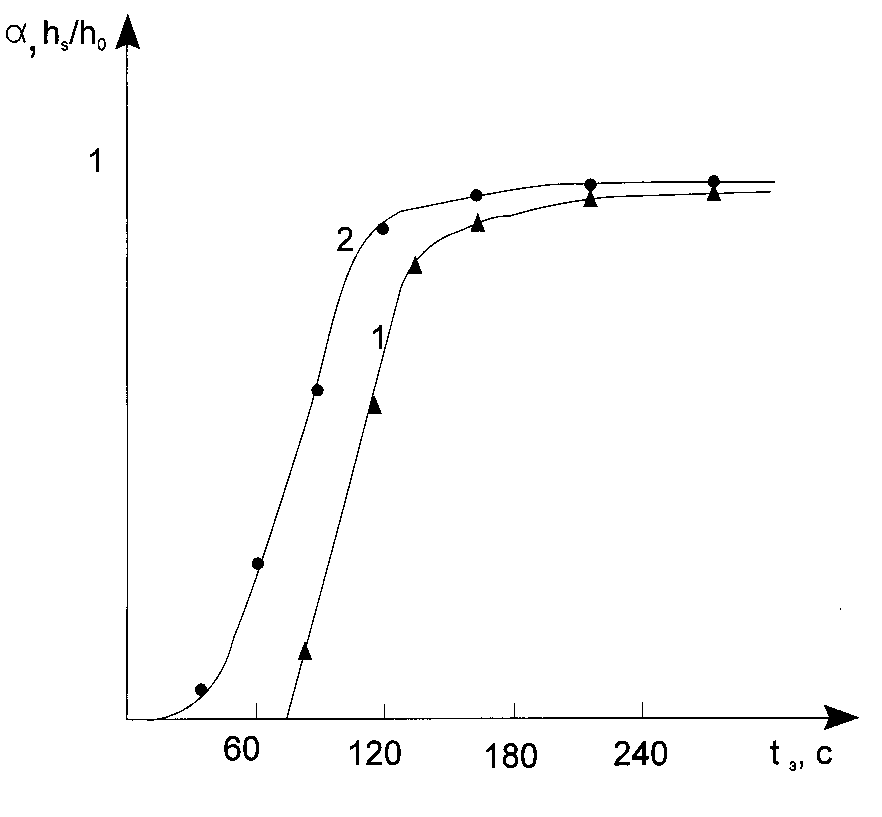
Characteristic and sensitometric curves reflecting the dependence of average conversion of monomers (oligomers) in a layer (a ) and thickness of residue film on a substrate after photoresist development (hS) upon exposure time (irradiation dose), respectively, have the most importance to test ( and characterized) PPP [3,4]. Fig.1 shows the typical values of the said kind for PPP in which radical polymerization has place.

Fig.1. Typical sensitometric (1) and characteristic (2) curves for the photopolymerizable composition layers.
If the polymerization reaction in PPP layers goes in the stationary regime, then an interpretation of such curves are quite unambiguous. Induction period in PPP is connected with conception of a radical polymerization inhibitor containing in the layer and can de calculated as [3,4]:
 (1)
(1)
where Cx and C0 are inhibitor and photoinitiator concentration in the layer; a l is rate constant of a photoinitiator decomposition; t i(x) and Hi(x) are time and dose demanding to consume all inhibitor containing in the layer; E0 is an intensity of light falling down onto the PPP surface.
Tangent of incline angle of the tangent in the point of bend of a characteristic curve corresponds to the maximum polymerization rate and can be written as [4]:
 (2)
(2)
where ![]() is average conversion of monomer is a layer; KP and K0 are rate constants of propagating
and terminating reaction of polymerization; D0l is optical density of a layer at the actinic
irradiation wavelength.
is average conversion of monomer is a layer; KP and K0 are rate constants of propagating
and terminating reaction of polymerization; D0l is optical density of a layer at the actinic
irradiation wavelength.
The last factor in (2) depends upon layer thickness and varies from 1 up to 0 when D0l grows from 0 to ¥ . If D0 £ 0.3 (the thin layer approximation), then one can consider the factor to be equal to 1.
In the case of densitometric curves an inductive period t i(x) directly connected with the threshold light sensitivity of a layer [4]:
 (3)
(3)
For PPP where polymerization reaction goes in the stationary regime one can obtain:
 (4)
(4)
where a k is minimal conversion of monomer in a layer that is necessary to gain complete loss of its dissolving in tested solvent [4].
Taking (1), (3) and (4) into account, one could obtain
 (5)
(5)
The last ratio unambiguously gives an evidence that the threshold light sensitivity of PPP that determined from characteristic curves can not coincide with the one determined from sensitometric curves.
The same situation has place for the contrast coefficient determination. Contrast coefficient usually define from sensitometric curves and take it equal to
 (6)
(6)
where H1 and H2 are energetic dose defining the range within which for the development procedure used thickness of residue layer on the substrate varies from zero to the starting value; Shl is light sensitivity of photoresist defined as a value reverse to energetic dose H2.
If contrast coefficient of PPP layers determine from characteristic curves then it will be equal to
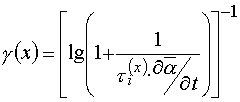 (7)
(7)
where ![]() defined in (2).
defined in (2).
The value dose not correspond to contrast coefficient g determined from sensitometric curves.
At fist, this can be concluded from (6), the threshold light sensitivity determination (3) and relation
(5). At second, as it was shown earlier [4], a sensitometric curve reflects kinetics of the
photochemical reaction front movement in PPP layer, and in the first approximation this value
depends on a K and ratio  , where
 ![]() is optical density of a layer at actinic radiation
wavelength after complete photoinitiator decomposition. For instance, for concrete case, when
is optical density of a layer at actinic radiation
wavelength after complete photoinitiator decomposition. For instance, for concrete case, when
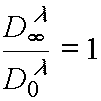 from theory background one could write for contrast coefficient g [3]:
 (8)
(8)
The ideas said above have a direct relation to the testing of PPP. The state of not is that unfortunately the authors of the works that are known to us does not give due attention to distinctions between sensitometrical and characteristic curves, and often their light sensitivity and resolution estimates are based upon characteristic curves analysis. This approach is not good both theoretically and practically.
It is known the proposals to use different variants of dilatometry to obtain sensitometric curves [5,10-12]. To analyses the PPP layers having thickness of 10-100 m , the laser interferometric method is more suitable from all method known. The method gives an opportunity to determine dependence of the layer thickness registered by the said methods are connected with monomer conversion in a layer, the latter value determining the value of composition contraction. In the case layer thickness change is proportional to an average conversion of monomer in a layer [3,4]:
 (9)
(9)
where a (h,t) is conversion of monomer in a layer at distance, h, from the irradiated surface at current time, t; h0 is layer thickness.
In other words, the said methods give us an information concerning not of variation of monomer conversion distribution along the layer of PPP (into its depth) that determines the shape of densitometric curve, but variation, of its average value. It is known [3,4] that sensitometric curve could be obtain from equation
![]() (10)
(10)
and there is no any way knowing a (t) to determine shape of hS(t).
The said can be applied also to the methods based upon double bonds determination [10], gel fraction determination [14] and heat evolution determination. All these methods so as the different variants of delatometry give us a possibility to register characteristic curve, a (t), but not sensitometric curve, hS(t). From this point of view the methods based on refractive coefficient measurement in the photoresist layer is differs from others. The state of the art is that due to the constructive peculiarities of the grate amount of refractometers the principle importance for measurement is the difference in refractive indexes –only at the interface between the two media – testing material, placed on measurement plane of reflectometer prism, and material on the prism itself. The latter caused the fact that when one uses such an installation to register kinetical curve the paramount importance has only those processes taking place in a photoresist layer that occurring in just neighborhood from a substrate (a refractive prism surface). In other words, in this case the kinetic curve does correspond not to a (t), but a (h0,t) the dependence reflecting variation of monomer conversion in the layer at distance, h0, from the irradiated surface. For practical goals this gives more outlined than in the case of the said former methods the seeming dependence of both inductive period and polymerization rate upon the photoresist layer thickness (See Fig.2). The latter is a consequence of the light intensity lowering due to absorption of the photoresist layer.
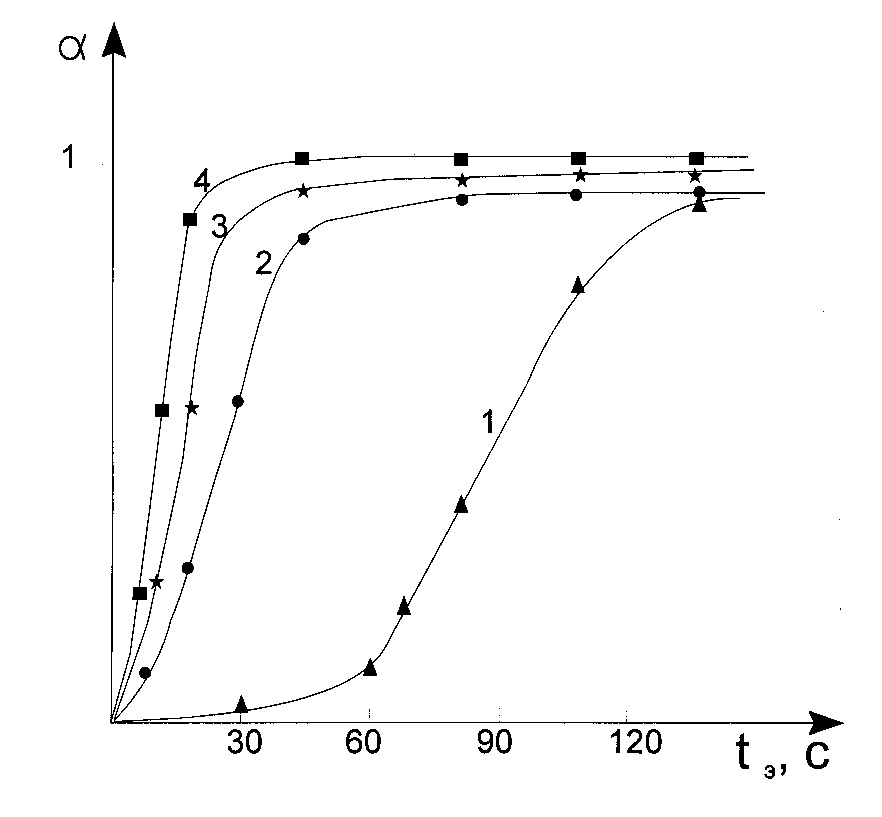
Fig.2. Characteristic curves for the photopolymerizable composition registered by means of refractive index determination (curve 1 and 2) and double bonds content determination (curves 3 and 4). Optical density of layers at 365 nm was 0.25 (curves 2 and 4) and 0.93 (curves 1 and 3).
Having the said above in mind one can conclude that the correct estimates of both light sensitivity and resolution of the photoresist layers may be produced starting from the sensitometric curves only. To register such a curve in this case of negative photoresists one should irradiate layer by light beams coming through a transparent substrate, then develop the irradiated article in the solvent tasted, and measure the photoresist layer thickness left on the substrate surface [14-17].
Both light sensitivities of layers and their resolutions depend upon Sthr tremendously. In the general case the photoresist layer light sensitivity can be determined [34] as following
 (11)
(11)
where, a *, is the minimal conversion of photoinitiator contained in a layer. This value is desirable to achieve the monomer conversion a k.
The rate constant of a photochemical reaction of photoinitiator decomposition, a l , is proportional to a product, e l · f , where e l is molar extinction coefficient of the photoinitiator at the actinic light wavelength, and f is quantum yield of its decomposition.
a * from (11) is connected with a k in the PPP layer with relation [3]
![]() (12)
(12)
where ![]() is an average length of polymerization chain and CM is monomer concentration in the PPP
layer.
is an average length of polymerization chain and CM is monomer concentration in the PPP
layer.
Here it was proposed that two free radicals were formed after the photoinitiator molecule decomposition, and these radicals could continue (lead) a polymerization chain.
If a polymerization reaction is in the stationary regime, and a chain termination occurs due to the second order kinetics (recombination or disproportion reaction), then [4]
 (13)
(13)
Owing to (12) and (13) and talking into account the inductive period existence (see eq 1), one can go
from eq 11 to eq 4 when ![]() The latter can be satisfied when the PPP layers use
substances with low values of molar extinction coefficients, e l , of less than 200-300 as
photoinitiator. The provide the polymerization rate to be high enough one must use the PPP layers
with a great excess amount of a photoinitiator. As a photoinitiator one can use many of carbonyl
compounds (benzophenone, various benzoin derivatives etc.) which excitation is connected with n-
p * electronic transitions [18,19].
The latter can be satisfied when the PPP layers use
substances with low values of molar extinction coefficients, e l , of less than 200-300 as
photoinitiator. The provide the polymerization rate to be high enough one must use the PPP layers
with a great excess amount of a photoinitiator. As a photoinitiator one can use many of carbonyl
compounds (benzophenone, various benzoin derivatives etc.) which excitation is connected with n-
p * electronic transitions [18,19].
Let us note, that a proposal about the stationary regime of photopolymerization reaction occurring in the PPP layer is not always correct. The latter has the most importance –for those PPP which contain so called matrix polymer to avoid cold flowing of the photoresist layer (e.g. dry film photoresists) [12,20]. An increase of viscosity of PPP is connected inevitably with restriction of molecular mobilities of reagents, and as consequence, with appearing the conditions typical for the solid state reactions (chemical reaction stop and reactivity smoothing, compensation effect, step-type kinetical curves) [21-24], in other words the system should to go to the state where polymerization reaction unlikely will be in stationary regime.
To describe polymerization reaction kinetics in non-stationary regimes and in the case of the second order termination of the polymerization state one can adopt for the first order approximation the following set of equations

 (14)
(14)
where Cp is free radical concentration in the layer that lead a polymerization chain.
Taking  (stationary condition), we obtain 14, and , consequently, 4. If
  ,
then solving of system (14), one can find out that
 (15)
(15)
Let us consider the two limiting cases. If ![]() , then
, then
 (16)
(16)
This case corresponds to non-terminated polymerization, that is when it is possible to neglect free radical disappearance completely during all periods of the PPP layer irradiation.
If ![]() , then
, then
![]()

 (17).
(17).
Comparing eqs 16 and 17 with 4, one can conclude that irrespective of whether polymerization
reaction in the PPP layers is in the stationary regime or not, linear dependence of ![]() , from
If
, from
If ![]() is more likely from theoretical point of view. However, as it can be easily seen from eqs 4,16
and 17, the inclination of such a curve in the coordinates
is more likely from theoretical point of view. However, as it can be easily seen from eqs 4,16
and 17, the inclination of such a curve in the coordinates  may differ considerably
from each other.
Other position that can not be eliminated from our consideration of the factors determining the threshold light sensitivity of PPP is the radical polymerization effectiveness incorporated into the PPP composition due to various reasons. Egs 4,16 and 17 can be fulfilled for the systems which use the radical polymerization inhibitors having properties close to the ideal ones. Effectiveness of an inhibitor is accepted to estimate by dimensionless parameter F that shows by what time the starting rate of polymerization of PPP without an inhibitor is more than the one with inhibitor [25,26]:
 (18)
(18)
where Kx is rate constant of polymerization chain termination by the inhibitor. F parameter can be found in the range from 1 to many dozens of thousands. In the case of the ideal inhibitors F is great enough (103-104) even at their low concentrations in PPP.
The next limiting case is that even at relatively high inhibitor concentrations in the layers
![]() value of F is not considerable (» 10). In the case
value of F is not considerable (» 10). In the case  ,
and the threshold light sensitivity of PPP is equal to [4]
 (19)
(19)
In contrast to eq 4 the threshold sensitivity does not depend of light intensity. The latter could be explain by the fact that polymer chain termination occurs at great excess of inhibitor due to the first order kinetically low.
An effectiveness of inhibitors depends from both their reactivity and their mobilities in the reaction
media. It is well known that when there has place transitional from liquid phase to solid phase
chemical reactions the rates almost all reactions become lower (the stop of the chemical reaction), the
faster reaction the more profound their rate constant lowering is (reactivity smoothing) [23,27-29].
This leads to that there is decrease of F with PPP viscosity increase in the case of all inhibitors when
content of matrix polymer in PPP increases. The above presentation permits to propose that under
variation of viscosity of the PPP layers one can observe a transition from situations where ![]() value
is determined as given in eq 4 to ones where
value
is determined as given in eq 4 to ones where ![]() is determined by eq 10. How do these transitions
look like?
is determined by eq 10. How do these transitions
look like?
It is easily to show that during an induction period conversion of monomer in a layer reaches a value given by the following expression
 (20)
(20)
If loss of solubility takes place at the same minimal conversion of monomer a K, then
 (21)
(21)
From eq 21 one can see that the inhibitor effectiveness decrease (decrease of Kx) must continuously
lead to decrease of an inline angle of lines representing the dependencies in the coordinates of
 keeping an interval of line cutting off from the ordinate axis at extrapolation of
 to
to ![]() .
.
The other fact which can be taken into account is connected with the PPP layer viscosity increase in the course of their irradiation. The latter may be a reason of both the rate constants of all elementary reactions (propagating and terminating of a polymerization chain) changing in the course of polymerization and the changing of polymerization mechanism that is connected, for instance, with a transition from terminated to non-terminated polymerization as a layer viscosity increasing. If we take into account the dependencies of rate constants of the elementary reactions with the monomer conversion in the layer, then it will be able to modified all the equations determining the threshold light sensitivity. For instance, eq 4 will take form as following
 (22)
(22)
and eq 19 –
 (23)
(23)
To take the polymerization mechanism change, one can introduce value a t showing at which conversion of monomer the change of polymerization mechanism takes place. If at a <a t termination of polymerization chain is caused by an inhibitor and at a >a t the polymerization process follows along non-terminating polymerization, then one will have
 (24)
(24)
It is seen from eq 24 (as it had place in previous cases) there is a linear depending of  from
from
![]() . But a line interval cut off from the ordinate axis at extrapolating of value
. But a line interval cut off from the ordinate axis at extrapolating of value  to
to ![]() ,
is not equal to
,
is not equal to  . When varying a concentration of matrix polymer it is reasonably to
expect that a t will change and, consequently, in contrast to eq 21 the lines in the
 coordinates will not start from one point on the ordinate axis.
All the cases considered were observed in experiments [4,12,20]. Depending of the PPP composition
the transitional processes connected within variations of the connect of matrix polymer in the PPP
compositions may be subdivided into three groups: (1) when increasing of the matrix polymer content
in the PPP composition leads to monotonous decreasing of incline angles in the coordinates of (
 ) ; all the lines will intersect in the only point belonging to the ordinate axis (this is
adequate to the proposals put in the course of eq 21 derivation); (2) when increasing of the matrix
polymer content in the PPP composition leads to the situation in which the incline angle is going to
zero; but, its variation is not monotonous (it will pass through the minimum, and the lines will not
intersect in the only point of the ordinate axis; (3) when increasing of the matrix polymer content in
the PPP composition there is no decreasing of the incline angle and the line do not start from the only
point on the ordinate axis.
The transitional processes character is a function of the reagent mobilities in the PPP layers [12,20].
The latter conclusion was done from observing variation of correlation times of rotational movements
(![]() ) of paramagnetic probe (2,2,6,6-tetramethyl-4-oxo-piperidine-1-oxyl) [30,31]. The transitional
processes of the type 1 and 2 were observed in the PPP layers where 2-4· 10-10 s £
) of paramagnetic probe (2,2,6,6-tetramethyl-4-oxo-piperidine-1-oxyl) [30,31]. The transitional
processes of the type 1 and 2 were observed in the PPP layers where 2-4· 10-10 s £ ![]() £ 8-10· 10-10 s [12,20]. When
£ 8-10· 10-10 s [12,20]. When ![]() £ 10-10 s the shape of
£ 10-10 s the shape of ![]() curves
does not depend of the reaction mobilities. The processes of type 3 were observed in the layers
where
curves
does not depend of the reaction mobilities. The processes of type 3 were observed in the layers
where ![]() >> 10-9 s.
>> 10-9 s.
Starting from the statement that the molecular mobility of reagents decreasing leads to decreasing of rates of all chemical reactions involved and at first the most fast processes decrease their rates and only then slower ones do the same (smoothing of reactivity [23]), one can expect that in the case of PPP the kinetically stop of the reaction proceeds in the following sequence having place at increasing of the matrix polymer content: terminating of the polymerization chain at the inhibitor, terminating of the chain as a result of recombination or disproportion, the reaction of the polymer chain growth. Having this in mind one can state that the transitional processes of type 1 and 2 must be connected with an inhibitor effectiveness decreasing in the PPP layers when viscosity of the latter increases, and the process of type 3 must be connected with increasing of the non-terminated polymerization contribution, that means there must be the processes taken into account in the course of eq 24 derivation. Distinction of the first and second type processes is that in the first case the polymerization process occurs in kinetically homogeneous media (monochromic kinetics), and in the second case the polymerization occurs in kinetically inhomogeneous regime [12]. Really, if there are two phases in the system, and the phases have different both compositions and reagent mobility, then eq 22 will take form
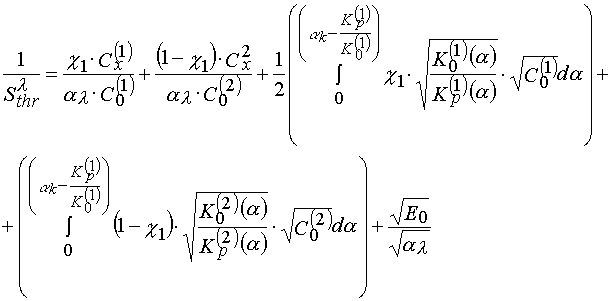 (25)
(25)
where ![]() is a portion of the first phase; all terms denoted with index 1 refer to the first phase
characteristics;
is a portion of the first phase; all terms denoted with index 1 refer to the first phase
characteristics; ![]() is a portion of the second phase.
is a portion of the second phase.
From eq 25 one can see that if variation of the matrix polymer content leads to ![]() parameter changing,
then there will have place both the unforeseen change in values of the incline angle in the (
parameter changing,
then there will have place both the unforeseen change in values of the incline angle in the (
 ) coordinates and variation of
 ![]() when E0 =0.
when E0 =0.
From all PPP compositions the most rare ones are those in which there have place the transitional processes of type 1 when the matrix polymer content variations occur. Such processes were observed in the PPP compositions containing dimethacrylatetrie-thyleneglycol (DTTE of TGM-3 trade mark) as an oligomer, and having homogeneous composition copolymer of butyl methacrylate and methacrylic acid containing 23± 1 mas. % of methacrylic acid [12]. In the same systems, but using inhomogeneous composition copolymers containing butyl methacrylate – methacrylic acid and methyl methacrylate - methacrylic acid the transitional processes of type 2 were observed 12,20]. The exceptional nature of compositions of type 1 is explained by DTA data (Fig. 3) [12,32]. The data presented say unambiguously about existence of two phases in the PPP layers containing the homogeneous composition butyl methacrylate – methacrylic acid copolymer and about existence of not less than three phases in the case of copolymers having inhomogeneous composition. We would like to point out that in the case of copolymer having homogeneous composition only Tg of liquid phase depends of the compositions. Such systems are to by gels having two phases where the liquid phase finely dispersed in the solid phase as droplets [33,34]. Rigid polymer network has a cement-forming effect upon the droplets of liquid DTTE, and this leads to Tg increasing, and, consequently, to limiting of the reagent molecular mobility. Absence of DTTE in the polymer network leads to the situation. When the system behaves itself as a monophase one, that is the polymerization kinetics remains to be monochromatic. A number of phase containing DTTE (in the other systems there exist more then one of the phases) leads to the polychromatic polymerization kinetics.
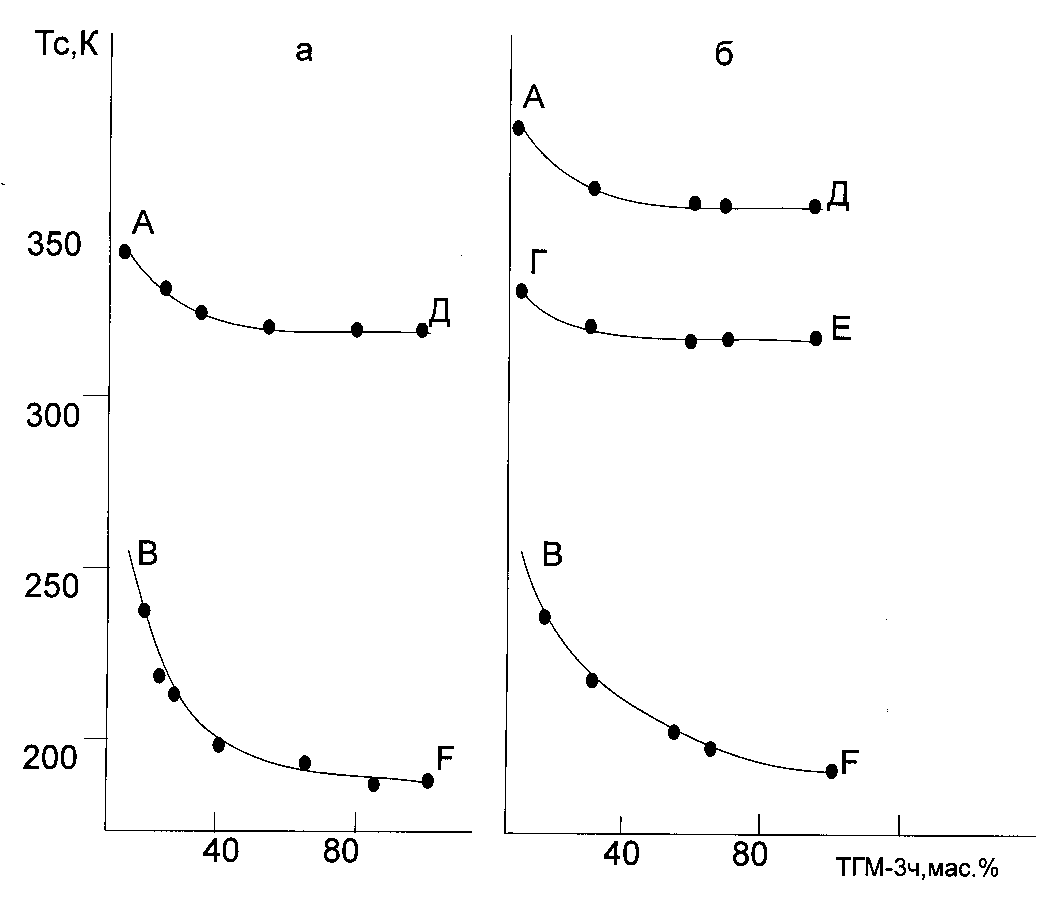
Fig.3. Tg – mixture composition diagram. Copolymer used was butyl methacrylate – methacrylic acid oligomer having TGM-3 trade mark. The curves for copolymer having the homogeneous composition denoted as (a) and non-homogeneous composition labeled as (b). BF is a line of glass transition of the phase, concentrated in respect to TGM-3; AD, GI – the glass transition of the phase, having big concentration of copolymer consisting of butyl methacrylate – methacrylic acid.
Here we must note out that such short correlation times (t k <<10-9 s) in the case of relatively large matrix polymer content in the system (50-80 mas.%) are observed only in microheterogeneous systems. As a rule when the polymer and oligomer have better compatibility at the same content of matrix polymer in the composition, then t k <<10-9 s [12], that makes it impossible to use the stationary state kinetics equations to describe polymerization of such systems.
Let us consider possible ways of estimating of the main parameters determining the threshold light
sensitivity of the PPP layers, and try to estimate an amount of information which they give. Due to
expression (1) ![]() depends of two parameters, al and a *. So as
depends of two parameters, al and a *. So as ![]() is determined
from the sensitometric curves, it is enough to estimate any of them to determine the said values. It is
simple enough to obtain the rate constant of the photochemical decomposition of a photoinitiator, a
l , in the case when as a result of the decomposition the products formed have the u.v. spectra
considerably different from the starting one, and a *>>0. Such methods were described in
[35,39], and they will not be considered here. Unfortunately, the said conditions fulfillment is not
typical for the most of the known photoinitiators of radical polymerizations. It may be noted that only
some of ortho-quinones used as a photoinitiators, for instance, phenantrenequinone, have
disappearing absorption bonds attributed to n-p *-transition [19]. For many of other
photoinitiator there are no noticeable changing of absorption spectra of the PPP composition layers
under the u.v. irradiation causing decomposition of the photoinitiator, but not any other process, such
as dye photooxidation.
is determined
from the sensitometric curves, it is enough to estimate any of them to determine the said values. It is
simple enough to obtain the rate constant of the photochemical decomposition of a photoinitiator, a
l , in the case when as a result of the decomposition the products formed have the u.v. spectra
considerably different from the starting one, and a *>>0. Such methods were described in
[35,39], and they will not be considered here. Unfortunately, the said conditions fulfillment is not
typical for the most of the known photoinitiators of radical polymerizations. It may be noted that only
some of ortho-quinones used as a photoinitiators, for instance, phenantrenequinone, have
disappearing absorption bonds attributed to n-p *-transition [19]. For many of other
photoinitiator there are no noticeable changing of absorption spectra of the PPP composition layers
under the u.v. irradiation causing decomposition of the photoinitiator, but not any other process, such
as dye photooxidation.
Due to eq 4 the rate constant of the photochemical decomposition of a photoinitiator may be
determined on the basis of the ![]() (E0) dependency studies:
(E0) dependency studies:
 (26)
(26)
To do this the results obtained are represented in the (![]() ), coordinate system, and
performing an extrapolation they find
), coordinate system, and
performing an extrapolation they find ![]() value at E0=0 (
value at E0=0 (![]() ) in eq 26). Let us note
that to estimate al using the above method it is necessary to know C0 and Cx, and it is
opposite to the al determination according to the method described in [35-39].
) in eq 26). Let us note
that to estimate al using the above method it is necessary to know C0 and Cx, and it is
opposite to the al determination according to the method described in [35-39].
As estimation of the rate constant of the photochemical decomposition of a photoinitiator al
starting from ![]() dependency is correct only in the case when the matrix polymer content
variation in the PPP composition lead to the transitional processes of type 1. In the opposite case, the
value obtained on the basis of eq 26 may have completely different meaning.
dependency is correct only in the case when the matrix polymer content
variation in the PPP composition lead to the transitional processes of type 1. In the opposite case, the
value obtained on the basis of eq 26 may have completely different meaning.
The rate constant of the photochemical reaction of the photoinitiator decomposition may be
determined on the basis of analysis of the characteristic curves, a(t) [5,26], too. Knowing value of
induction period, the intensity of the u.v. irradiation falling onto the surface of the photoresist layer,
concentrations of photoinitiator and inhibitor, they can calculate al constant using relation 1. At
the first view this method differs not greatly from the previously described. But namely this method
has to be chosen. This conclusion is based on the following. At first, an error in estimating of
![]() in eq 26 depends from two variables being determining; but t i(x) in eq 1
depends from the only variable, that is the exposure time. At second, if a k parameter depends
from E0, then from any equation determining the threshold light intensity of a layer, it could be seen
that
in eq 26 depends from two variables being determining; but t i(x) in eq 1
depends from the only variable, that is the exposure time. At second, if a k parameter depends
from E0, then from any equation determining the threshold light intensity of a layer, it could be seen
that ![]() does not correspond to
does not correspond to  .
.
Unfortunately, we are forced to state, that the latter method of a l parameter determination is not unique. As it was pointed out above the limitation of the reagent mobility in a reaction media can lead to decrease of the inhibitor effectiveness, and, as a consequence, to elimination of an inductive period. The latter does it impossible to estimate a k parameter. We can offer two ways out in the situation. The first one is to use the model systems where there are no limitations for molecular mobilities. The second one is to use the inhibitors having the effectiveness in the conditions imposed being high enough. Other limitation is connected with an existence of the probability process of quenching of the photoinitiator excited states by inhibitor molecules. First of all this is true for the photoinitiators generating free radicals as a result of photoredox-process (Norrish II reaction). Participation of the long living triplet states of the photoinitiators in the process gives an opportunity of the polymerization initiation rate decreasing in the presence of some substances, which have an ability to be an acceptor in the course of triplet-triplet energy transfer. From this point of view there some advantages left for the photoinitiators generating free radicals according to Norrish I reaction; the substituted derivatives of benzoine are of the said type [5]. Fig.4 shows the characteristic curves registered by IR methods for system having the only distinction, the type of the photoinitiator used.
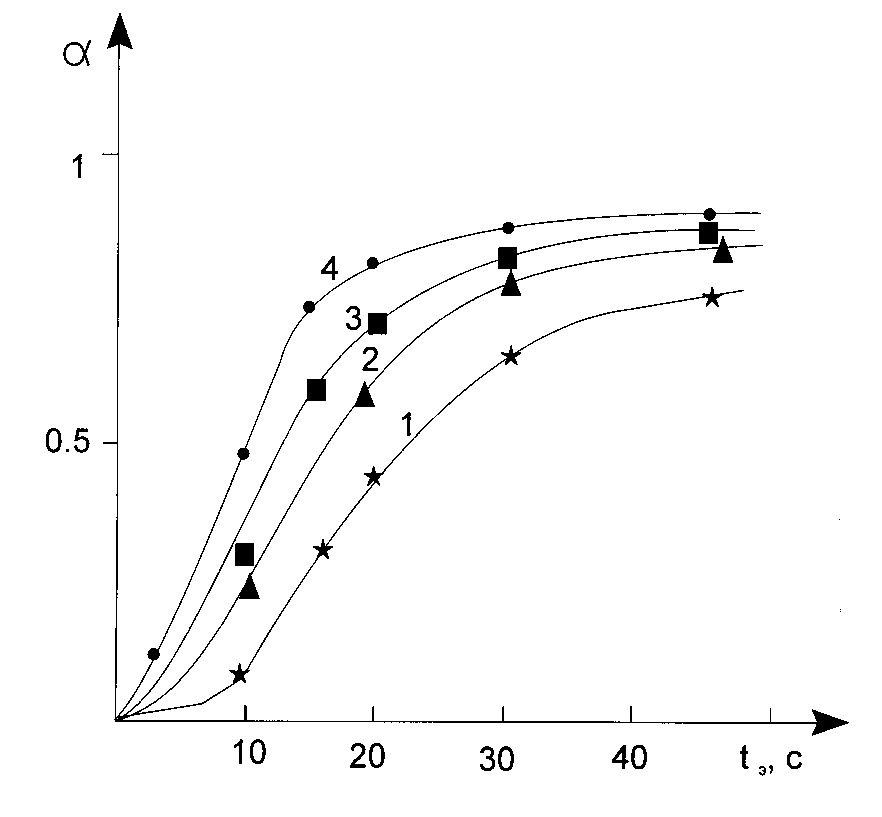
Fig.4 The characteristic curves registered by IR spectroscopy, when iso-bytil bensoine ester (curves 2 and 3) and dimethoxiphenylacetophenone (curves 1,4) are used as photoinitiator. Curves 2 and 4 were registered during the first day and night period from the moment of the composition preparation. Curves 1 and 3 are registered after 5 day and nights storing.
In the case of the system using iso-butyl bensoine ester the shape of the kinetically curves remain unchanged after 3-5 nights storing of the composition. The different situation is observed in the case of dimethoxyphenylacetophenone (curve 3 and 4). Curve 4 has greater induction period than curve 3 (about 2.5 times greater). And under the condition, if we try to inspect tangent of the incline of tangent of the kinetically curves in the points of their bend, we can conclude that rates of polymerization in the system remain unchanged after complete consumption of the inhibitor. So as the inhibitor concentration (orthto-quinone) in all systems being the same, then an increase of the induction period may be explained by formation of complexes of the photoinitiator and inhibitor, in the case of which formation we have a seeming decrease (temporary, up to the moment when the inhibitor becomes exhausted) of rate constant of the photoinitiator photochemical decomposition, and, consequently, an increase of the induction period keeping the rate of non-inhibited polymerization constant. Considerably greater effect of the type (elongation of the induction period by about 50 times) was observed when benzophenone was used as a photoinitiator. The photoinitiator generates free radicals exclusively due to Norrish II reaction, that is with the photoinitiator triplet state participation.
Knowledge of the rate constant of the photochemical decomposition of the photoinitiator a
l gives an opportunity to determine some of the other interval parameters of the PPP layers
effecting upon their threshold light sensitivity. On the basis of the dependency ![]() represented
in the
represented
in the  coordinates, one can determined tangent of the incline angels of the lines
![]() and calculated relation
and calculated relation
 (27)
(27)
starting from the characteristic curve, a (t), reflecting the dependency of an average conversion of a monomer in a layer from exposure time, one can determine tangent of the incline angle of a tangent in the point of bend of the given curve (2) and find
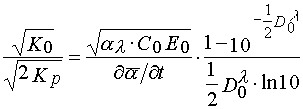 (28)
(28)
Dividing eq 27 per 28, one find value of the parameter
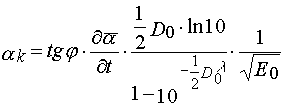 (29)
(29)
The procedure described above to determine the internal parameters of the PPP layers is concerned only of the systems in which the said transitional processes are of type 1. The same procedure may be used also to determine the internal parameters of the systems in which the threshold light sensitivity is defined by eq 19. For all other systems the correct determination of the internal parameters of the PPP layers remain unclear.
Let us discuss main factors determining the contrast coefficient of a photoresist. Due to eq 6 the
contrast coefficient, ![]() , depends of values,
, depends of values, ![]() . Ratio
. Ratio ![]() depends of two
parameters,
depends of two
parameters, ![]() and
and ![]() [2,40] ( Fig. 5).
[2,40] ( Fig. 5).
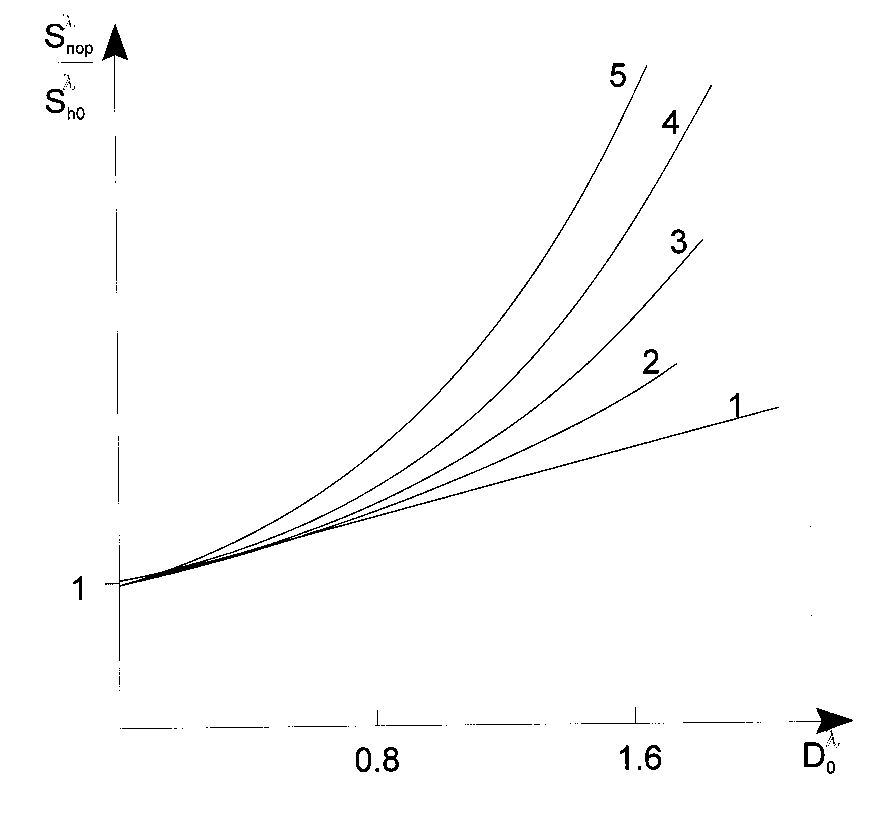
Fig. 5. Dependency of the photopolymerizable composition contrast with their optical density at
ratios ![]() of 0 (1), 0.1 (2), 0.5 (3), 1.0 (4) and 2.0 (5).
of 0 (1), 0.1 (2), 0.5 (3), 1.0 (4) and 2.0 (5).
Fig. 5 shows that ![]() when
when ![]() ; in the case the most
; in the case the most ![]() values can be reached for
values can be reached for
![]() in the case of any possible
in the case of any possible ![]() . Practically this means that to achieve the highest
resolution of the mask forming process it is necessarily to prefer the photoresists having less optical
density at a given wavelength of the actinic radiation used. To achieve the latter it is necessarily: (1) to
set such a selection and purity of the main components of the PPP composition (with exception of a
photoinitiator) that could guarantee a complete elimination of the u.v. light absorption with a
wavelength of
. Practically this means that to achieve the highest
resolution of the mask forming process it is necessarily to prefer the photoresists having less optical
density at a given wavelength of the actinic radiation used. To achieve the latter it is necessarily: (1) to
set such a selection and purity of the main components of the PPP composition (with exception of a
photoinitiator) that could guarantee a complete elimination of the u.v. light absorption with a
wavelength of ![]() by the photoresist layer (without the photoinitiator); (2) to use the photoinitiator
concentrations (in the PPP layer) which are less than
by the photoresist layer (without the photoinitiator); (2) to use the photoinitiator
concentrations (in the PPP layer) which are less than ![]() . This means that the radical
photopolymerization photoinitiators having lower values of mole extinction coefficients have the
special importance to obtain the PPP layers with high contrast.
. This means that the radical
photopolymerization photoinitiators having lower values of mole extinction coefficients have the
special importance to obtain the PPP layers with high contrast.
Due to the theoretical findings (see eq 8 and Fig. 5) the contrast coefficient, ![]() , increases
tremendously when optical density,
, increases
tremendously when optical density, ![]() , of a layer decreases. But this, as a rule, has no place. A
reason of this is in that for the real systems if complete loss of solubility is observed at conversions
of monomers,
, of a layer decreases. But this, as a rule, has no place. A
reason of this is in that for the real systems if complete loss of solubility is observed at conversions
of monomers, ![]() , then the partial one is observed when
, then the partial one is observed when ![]() . One can do not take
into account
. One can do not take
into account ![]() in the light sensitivity determination, but not in the contrast coefficient determination.
Due to [4] when
in the light sensitivity determination, but not in the contrast coefficient determination.
Due to [4] when ![]() , then
, then ![]() goes to the limit value of
goes to the limit value of
 (30)
(30)
where ![]() ,
, ![]() is an exposure dose which is necessary to achieve the complete
monomer conversion in the layer, having the value of
is an exposure dose which is necessary to achieve the complete
monomer conversion in the layer, having the value of ![]() ,
, ![]() .
.
D H and Hc in eq 30 may be determined experimentally. We must note that when someone
studies the PPP layers having optical densities, ![]() , it will not possible to determine the
sensitometric curves, representing dependency of the thickness of layer left on the surface of
substrate after the photoresist layer development from an exposure dose, as in the layer the
polymerization rate remain almost unchanged along the depth direction ( in other words there is no
layer-to-layer polymerization). Having the latter in mind we can propose the following method that is
most suitable to estimate the said values. The photoresist layer is coated onto the rectangle substrates
having a given length, for instance (10 cm long). The substrates with the photoresist layer thereon is
exposed by means of an installation that consists of stationary situated u.v. light source giving an
homogeneous intensity of the photoresist layer surface, u.v. light filter, separating the desirable
wavelength, non-transparent screen and the exposure table moving with constant rate. One begins
exposure of the PPP layer simultaneously with the table movement the said screen. The procedure
gives an opportunity of relate a gradient of an exposure dose along one of the substrate dimensions.
The PPP layer irradiated in such conditions is developed in desired solvent. Three zones become left
after the development.
, it will not possible to determine the
sensitometric curves, representing dependency of the thickness of layer left on the surface of
substrate after the photoresist layer development from an exposure dose, as in the layer the
polymerization rate remain almost unchanged along the depth direction ( in other words there is no
layer-to-layer polymerization). Having the latter in mind we can propose the following method that is
most suitable to estimate the said values. The photoresist layer is coated onto the rectangle substrates
having a given length, for instance (10 cm long). The substrates with the photoresist layer thereon is
exposed by means of an installation that consists of stationary situated u.v. light source giving an
homogeneous intensity of the photoresist layer surface, u.v. light filter, separating the desirable
wavelength, non-transparent screen and the exposure table moving with constant rate. One begins
exposure of the PPP layer simultaneously with the table movement the said screen. The procedure
gives an opportunity of relate a gradient of an exposure dose along one of the substrate dimensions.
The PPP layer irradiated in such conditions is developed in desired solvent. Three zones become left
after the development.
the irradiation may be done both through the PPP layer and through a substrate transparent to the u.v. light.
From eq 30 it follows that an increase of the contrast coefficient, ![]() , is connected with an
increase of Hc and decrease of
, is connected with an
increase of Hc and decrease of ![]() . Let us consider by what means can it be realized.
. Let us consider by what means can it be realized.
Variant 1. Due to eq 4 the increasing of Hc may be achieved with an increase polymerization, inhibitor concentration in the PPP layer. This variant is considered in details in [41-43]. It was shown that the effect has place only in the case when the compounds generating free radicals as a result of a direct photo dissociation use as radical polymerization photoinitiators. To achieve the desired level of resolution of a photolithography process it is necessary to impose the following conditions:
 (31)
(31)
 (32)
(32)
where D is an inhibitor diffusion coefficient in the PPP layers; B is the maximum element dimension which can be reproduced.
Due to eqs 31 and 32 an increase of resolution of a photolithography process (decreasing of B) is really connected with an inhibitor concentration increase in the PPP layers. But it is necessarily in the case to increase the u.v. light intensity, E0. The latter can be explained by necessity of exclusion of the inhibitor redistribution in the PPP layers in the course of irradiation through a photo mask as a result of diffusion [41,42].
As both the u.v. light intensity and the inhibitor concentration in the PPP layers are proportional to the inhibitor diffusion coefficient it might seem that a realization of the conditions mentioned above is easy for the PPP compositions which has consistency more close to the solid state than to the liquid one. But as we have pointed out yet the reagent mobility limitation in a reaction media leads with necessity to decreasing of the inhibitor efficiency and consequently to decreasing of the contrast coefficient of the photoresists. In this relation the most perspective PPP combine both low transnational diffusion and high local mobility of them. The combination as it was shown [12,32] suggests the creation of the layers being two phase micro heterogeneous systems in which monomer molecules (reaction media) are represented as droplets in the rigid polymer framework (Fig.3).
Expressions 31 and 32 in the thin layer approximation give an opportunity to calculate the contents of the PPP compositions and determine an exposure characteristics (intensity of u.v. light and its spectral composition) to realize the photolithography process of a given resolution and to achieve its technological stability.
Variant 2. Eqs 30 and 4 suggest that an increase of the contrast coefficient, ![]() , may be achieved by
the same means as in the case of
, may be achieved by
the same means as in the case of ![]() increase. The contrast coefficient
increase. The contrast coefficient ![]() will increase when the
monomer conversion is increasing starting from the value at which the loss of solubility is observed
for the solvent used. It may be noted that the statement is quite universal, and it was proved for
different systems used [2,44]. In the general case an increase of
will increase when the
monomer conversion is increasing starting from the value at which the loss of solubility is observed
for the solvent used. It may be noted that the statement is quite universal, and it was proved for
different systems used [2,44]. In the general case an increase of ![]() may be achieved by variation of
both the solvent used (by development of high contrast developers ) and the PPP composition. The
first method is very effective in the case of positive photoresists based upon
ortho-naphthoquinone-diazides [45- 48]. For the negative photoresists an increase of the contrast
coefficient is connected with their composition modification.
may be achieved by variation of
both the solvent used (by development of high contrast developers ) and the PPP composition. The
first method is very effective in the case of positive photoresists based upon
ortho-naphthoquinone-diazides [45- 48]. For the negative photoresists an increase of the contrast
coefficient is connected with their composition modification.
What can lead to the ![]() increasing ? To find an answer for the given question let us consider
peculiarities of 3D radiation induced polymerization. On the basis of the great number of the
experimental data [49] we may assume that a qualitative picture of the polymerization mechanism of
oligomers containing more than one group per an oligomer molecule depending of the oligomer nature
and the polymer processing parameters can change from the microheterogeneous to homogeneous.
In the case of the microheterogeneous mechanism of polymerization it is characteristic that almost
from the very beginning the process proceeds by enlargement of mass of the microgel particles (
grains) without an increase of the concentration in the system. Concentration of the growth centers
(grains) [49,50] depends with the oligomer properties and the polymerization initiating rate. The
physical meaning of the microheterogeneous polymerization mechanism can be presented as that the
polymerization process itself (growth of grains) has place in very thin peripheral layer being the
interface of the solid polymer (grain)/ liquid oligomer. In other words at the starting stage of the
polymerization the reaction mixture is represented by a dispersion state where very rigid grains play a
role of the dispersed phase, and the starting liquid oligomer plays a role of the dispersive media
(continuous zone). In the course of polymerization the grains grow and the moment comes when the
grain dimensions become of such a value that the grains become bordering each other and begin to
join together into united framework structure due to polymerization in the joined zone. In other words
at some conversion of oligomer, say
increasing ? To find an answer for the given question let us consider
peculiarities of 3D radiation induced polymerization. On the basis of the great number of the
experimental data [49] we may assume that a qualitative picture of the polymerization mechanism of
oligomers containing more than one group per an oligomer molecule depending of the oligomer nature
and the polymer processing parameters can change from the microheterogeneous to homogeneous.
In the case of the microheterogeneous mechanism of polymerization it is characteristic that almost
from the very beginning the process proceeds by enlargement of mass of the microgel particles (
grains) without an increase of the concentration in the system. Concentration of the growth centers
(grains) [49,50] depends with the oligomer properties and the polymerization initiating rate. The
physical meaning of the microheterogeneous polymerization mechanism can be presented as that the
polymerization process itself (growth of grains) has place in very thin peripheral layer being the
interface of the solid polymer (grain)/ liquid oligomer. In other words at the starting stage of the
polymerization the reaction mixture is represented by a dispersion state where very rigid grains play a
role of the dispersed phase, and the starting liquid oligomer plays a role of the dispersive media
(continuous zone). In the course of polymerization the grains grow and the moment comes when the
grain dimensions become of such a value that the grains become bordering each other and begin to
join together into united framework structure due to polymerization in the joined zone. In other words
at some conversion of oligomer, say ![]() , the phase inversion has place, that means that rigid 3D
crosslinked polymer becomes to be dispersive media and partly polymerized liquid oligomer
becomes to be a dispersed phase. An important consequence of microheterogeneous mechanism is
an existence of some critical conversion of monomer,
, the phase inversion has place, that means that rigid 3D
crosslinked polymer becomes to be dispersive media and partly polymerized liquid oligomer
becomes to be a dispersed phase. An important consequence of microheterogeneous mechanism is
an existence of some critical conversion of monomer, ![]() , at which an abrupt change of properties
of a relief formed occurs. It is reasonable to suppose that in such processes
, at which an abrupt change of properties
of a relief formed occurs. It is reasonable to suppose that in such processes ![]() as determined by eq
30 is approximately equal to
as determined by eq
30 is approximately equal to ![]() , i.e. it corresponds to the moment when the phase inversion
occurs. It is shown that when the microheterogeneous polymerization mechanism has place, then it
will be reasonable to assume that
, i.e. it corresponds to the moment when the phase inversion
occurs. It is shown that when the microheterogeneous polymerization mechanism has place, then it
will be reasonable to assume that ![]() > 0.5 [49]. This value is quite large conversion to have
considerable surplus of the photoresist resolution. More detailed information about factors
determining
> 0.5 [49]. This value is quite large conversion to have
considerable surplus of the photoresist resolution. More detailed information about factors
determining ![]() value one can find in [49,50]. The homogeneous polymerization mechanism suggest
space continuousness and exclusion of abrupt changes of properties of formed relief. In the given
case it is unlikely that
value one can find in [49,50]. The homogeneous polymerization mechanism suggest
space continuousness and exclusion of abrupt changes of properties of formed relief. In the given
case it is unlikely that ![]() may be as large as for the microheterogeneous polymerization mechanism.
Thus one of the possible and the most cardinal ways to increase
may be as large as for the microheterogeneous polymerization mechanism.
Thus one of the possible and the most cardinal ways to increase ![]() is a realization of the
microheterogeneous polymerization mechanism in the PPP layers.
is a realization of the
microheterogeneous polymerization mechanism in the PPP layers.
What does the oligomer polymerization mechanism depend with ? From our point of view it does depend with whether the polymerization rate increase will have place or not when the oligomer conversion in the reaction zone increases. If the former situation has place, then the microheterogeneous polymerization mechanism is more preferable, if the latter one has place, then the mechanism is homogeneous. This statement is supported by experimental data presented on Fig. 6 [18,20]. Fig. 6 shows that the dependency of the threshold light sensitivity of the PPP layers with the reagent mobility has an extreme shape.
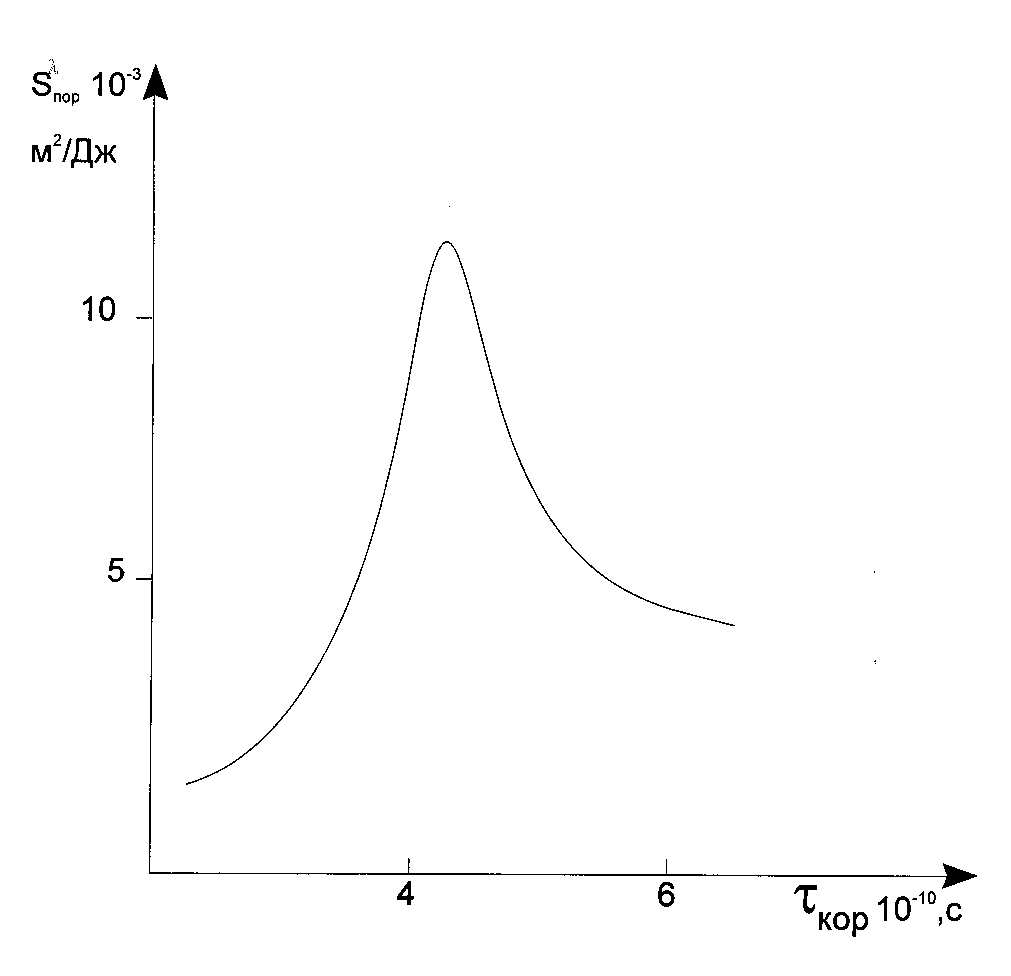
Fig. 6. Dependency of the threshold light sensitivity of the layers with the reagent mobilities built on the basis of the results presented in [12].
The light sensitivity of the layer is abruptly increases with increasing of correlation time, ![]() , in a
range from 1· 10-10 to 4· 10-10 s, and when
, in a
range from 1· 10-10 to 4· 10-10 s, and when ![]() > 4· 10-10 s, then the light
sensitivity decreases. The characteristic curves for which
> 4· 10-10 s, then the light
sensitivity decreases. The characteristic curves for which ![]() > 4· 10-10 s (Fig. 7 shows their
interferegrams giving better illustration the stated below), unambiguously suggest that the rate of the
polymerization reaction decrease in the course of its progress (i.e. an increase of the oligomer
conversion, and consequently, an increase of the composition viscosity).
> 4· 10-10 s (Fig. 7 shows their
interferegrams giving better illustration the stated below), unambiguously suggest that the rate of the
polymerization reaction decrease in the course of its progress (i.e. an increase of the oligomer
conversion, and consequently, an increase of the composition viscosity).
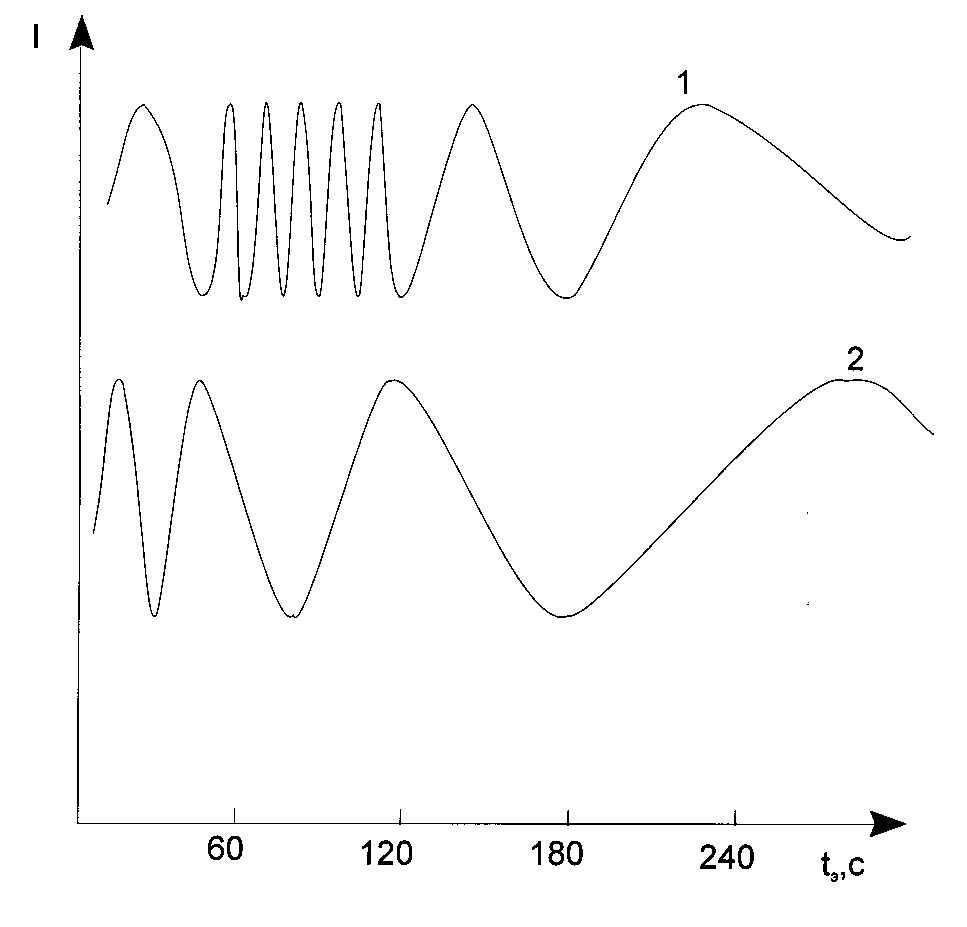
Fig. 7. Typical shape of interferegrams obtained under u.v. light exposure of the photopolymerizable
composition where 1 - ![]() < 4· 10-10 s, 2 -
< 4· 10-10 s, 2 - ![]() > 4· 10-10 s. I is an intensity of laser
reflected beam.
> 4· 10-10 s. I is an intensity of laser
reflected beam.
In other words, here we have complete correspondence of the dependency of the polymerization rate
with the monomer conversion and the dependency of the layer sensitivity with their viscosity.
Completely other results have place in the case of layers having ![]() < 4· 10-10 s. It might seem
that in the present case when the monomer conversion in the layer increases (an increase of the
viscosity of reaction media) then the polymerization rate has to increase abruptly. However in reality
for long enough period of time (for conversion of monomer in the layer not less than 0.5) it remains
constant. The latter becomes possible (as it follows from the above description) only in the case
when polymerization takes a microheterogeneous mechanism. If we deal with exclusively oligomers
then they have
< 4· 10-10 s. It might seem
that in the present case when the monomer conversion in the layer increases (an increase of the
viscosity of reaction media) then the polymerization rate has to increase abruptly. However in reality
for long enough period of time (for conversion of monomer in the layer not less than 0.5) it remains
constant. The latter becomes possible (as it follows from the above description) only in the case
when polymerization takes a microheterogeneous mechanism. If we deal with exclusively oligomers
then they have ![]() < 4· 10-10 s when they have viscosity less than 25· 106 m2 s-1 [12].
It is quite movable liquids and direct use of them in photolithography is limited due to the known
reasons. In this turn as for variant 1 we can make a conclusion that to realize the microheterogeneous
polymerization mechanism it is necessary to have the PPP layers being two-phase
microheterogeneous systems in which liquid oligomer is situated (dispersed) as microdroplet
captured in rigid polymer framework. In the case the oligomethacrylate ester of TGM-3 mark [12].
There are all prerequisites to state that its polymerization takes the microheterogeneous mechanism
[49].
< 4· 10-10 s when they have viscosity less than 25· 106 m2 s-1 [12].
It is quite movable liquids and direct use of them in photolithography is limited due to the known
reasons. In this turn as for variant 1 we can make a conclusion that to realize the microheterogeneous
polymerization mechanism it is necessary to have the PPP layers being two-phase
microheterogeneous systems in which liquid oligomer is situated (dispersed) as microdroplet
captured in rigid polymer framework. In the case the oligomethacrylate ester of TGM-3 mark [12].
There are all prerequisites to state that its polymerization takes the microheterogeneous mechanism
[49].
The realization of the microheterogeneous mechanism in the PPP layers are considered by us to be
one of the main ways to improve ![]() and, consequently, the photoresist contrast coefficient. Are
there any other ways to increase
and, consequently, the photoresist contrast coefficient. Are
there any other ways to increase ![]() ? The most obvious way is the following one. It should be held
in mind that in the PPP layers two processes can occur simultaneously: the polymerization itself and
“crosslinking” of the matrix polymer being a component of PPP compositions. An exclusion of the
second processes even if in the earlier stages of polymerization permits to increase
? The most obvious way is the following one. It should be held
in mind that in the PPP layers two processes can occur simultaneously: the polymerization itself and
“crosslinking” of the matrix polymer being a component of PPP compositions. An exclusion of the
second processes even if in the earlier stages of polymerization permits to increase ![]() considerably.
To do this it is necessarily in its turn to exclude the polymerization chain transfer onto the matrix
polymer macromolecules. This is possible if the latter does not contain active hydrogen atoms which
could be easily abstracted from the macromolecules of the polymer by free radicals generated in the
course of the PPP layer exposure. Negative role of “crosslinking” reaction against the highest
resolution of the lithographic process of the resist mask forming is considered in [51].
considerably.
To do this it is necessarily in its turn to exclude the polymerization chain transfer onto the matrix
polymer macromolecules. This is possible if the latter does not contain active hydrogen atoms which
could be easily abstracted from the macromolecules of the polymer by free radicals generated in the
course of the PPP layer exposure. Negative role of “crosslinking” reaction against the highest
resolution of the lithographic process of the resist mask forming is considered in [51].
Other ways that can lead to the photoresist contrast coefficient enhancement are connected with
decrease of ![]() and
and ![]() in eq 30.
in eq 30.
First of all we should like to note that all factors that lead to the enhancement of ![]() and Hc
inevitably lead to
and Hc
inevitably lead to ![]() and
and ![]() decreasing. In this connection we believe that the most effective ways
to enhance
decreasing. In this connection we believe that the most effective ways
to enhance ![]() are those which were considered above.
are those which were considered above.
If one uses eq 4 to estimate values of ![]() and Hc in eq 30, then the latter relation can be represented
in the following form:
and Hc in eq 30, then the latter relation can be represented
in the following form:
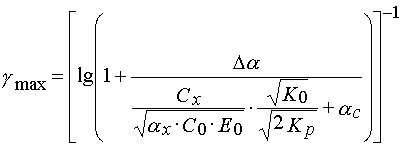 (33)
(33)
From eq 33 one can see that without increase of Cx and ![]() and decrease of
and decrease of ![]() the contrast
coefficient
the contrast
coefficient ![]() may be increased by decreasing of the ratio
may be increased by decreasing of the ratio ![]() and product
and product ![]() . The ratio
. The ratio ![]() depends upon both oligomer reactivity and their mobilities in the PPP layers.
In this connection as selection of oligomer and the mixtures and ration between contents of the matrix
polymer and oligomer could be considered as being reasonable from the point of view of the PPP
composition finding which leads to the highest resolution of the layers. This method, probably, is the
most effective in the case where due to some reasons there is no possibility to have large values of
depends upon both oligomer reactivity and their mobilities in the PPP layers.
In this connection as selection of oligomer and the mixtures and ration between contents of the matrix
polymer and oligomer could be considered as being reasonable from the point of view of the PPP
composition finding which leads to the highest resolution of the layers. This method, probably, is the
most effective in the case where due to some reasons there is no possibility to have large values of
![]() and small ones of
and small ones of ![]() . Particularly the latter is true for all PPP compositions having matrix
polymer as a component, but not having two-phases microheterogeneous structure.
. Particularly the latter is true for all PPP compositions having matrix
polymer as a component, but not having two-phases microheterogeneous structure.
As for the method connected with product ![]() decreasing we can state that it has its
limitations. The situation is that that it is not possible to decrease the photoinitiator concentration in
the layer unlimitedly, because the inequality
decreasing we can state that it has its
limitations. The situation is that that it is not possible to decrease the photoinitiator concentration in
the layer unlimitedly, because the inequality ![]() must be true always; in the opposite case the
desired extend of the oligomer polymerization can not be achieved. Decreasing of the product
must be true always; in the opposite case the
desired extend of the oligomer polymerization can not be achieved. Decreasing of the product
![]() is limited by necessity to keep true the inequality 31. It is possible only to state
unambiguously that the product
is limited by necessity to keep true the inequality 31. It is possible only to state
unambiguously that the product ![]() must be optimized.
must be optimized.
As a conclusion we must outline the following. In the present article an attempt to reveal the cause-consequence relation of the PPP layer light sensitivity with its composition and structure – dynamic properties of the layers. Unfortunately, it is necessary to state that there was no attention given to the problem in literature. As a rule they consider the PPP compositions development as an inventory activity, and in this connection the PPP composition description are among the leader in respect to a number of inventory claims made [7,9]. To some degree the situation is a result of believe that the photoinitiated photopolymerization almost does not differ from thermally initiated one, and its study has no interest from the point of view of science [52]. On the other hand it is quite clear the striving of all researchers studying the photopolymerization processes for working with individual oligomers (monomers), but not with their mixtures, and more – with such complicated systems as the PPP compositions used in photolithography. In this respect opinions of the authors of the present article are in opposition to the convenient ones. In the article we wanted to show that in spite of complexity of such systems it can be found an approach which gives a possibility to study and understand processes involved in the polymerization. The described approach was realized for development of the frontier polymerization method giving an opportunity to produce the optically transparent articles using the one-stage scheme [53-55].
References
1. V.M.Treushnikov, Yu.I.Koltsov// Electronic technique reviews. 1989. B. Materials. No.8. P.26 (in Russ.).
2. V.M.Treushnikov, A.V.Oleinik// J. Sci. and Appl. Photogr. and Cinematogr. 1991.V.35. No.3. P.189 (in Russ.).
3. V.M.Treushnikov, V.I. Tcherednik, A.V.Oleinik// Proc. of Nozhnii Novgorod University. Materials, Processes and Electron Technologies. Nizhnii Novgorod. 1994. P.5 (in Russ.).
4. V.M.Treushnikov, N.V.Zelentsova, A.V.Oleinik// J. Sci. and Appl. Photogr. and Cinematogr. 1987.V.32. No.4. P.308 (in Russ.).
5. V.K.Grishenko, A.F.Masluk, S.S.Gudzera. Liquid photopolymerizable compositions. Kiev. Naykova Dumka.1985.P.206. (in Russ.).
6. W.Maurean. Microlithography. Moscow.Mir.1990.P.1239.
7. Photochemical processes in the layers./Ed.by A.V.Eltsov. Leningrad. Chemia. 1978.P.232 (in Russ.).
8. Yu.S.Bokov. Photo-, E-Beam, and X-Ray resists. Moscow.Radio and Svjaz. 1982.P.136 (in Russ.).
9. Light sensitive polymer materials./Ed. by A.V.Eltsov. Leningrad. Chemia. 1982. P.296 (in Russ.).
10. A.F.Masluk, A.V.Peremischkin et al.//J.Chem.and Appl.Photogr.and Cinematogr. 1985.V.30.No.4.P.253 (in Russ.).
11. V.V.Semenov, N.F.Tcherepennikova, V.M.Treushnikov and al.//Polymer Sci. A. 1994.V.36.No.1.P.46 (in Russ.).
12. V.M.Treushnikov, S.A.Esin at al.// Polymer Sci. A. 1995.V.37.No.12.P.1973 (in Russ.).
13. A.F.Masluk, V.A.Khranovskii, G.N.Bereznitskii et al. //J.Sci.and Appl.Photogr. and Cinematogr. 1994.V.39.No.3.P.16 (in Russ.).
14. V.V.Schibanov, A.P.Romanuk, S.N.Mikishin // J.Sci.and Appl.Photogr. and Cinematogr. 1992.V.38.No.3.P.226 (in Russ.).
15. K.S.Ljalikov, Yu.E.Kirsh, K.A.Kovaleva et al. //J.Sci.and Appl.Photogr.and Cinematogr. 1965.V.10.No.3.P.300 (in Russ.).
16. Yu.E.Kirsh, K.S.Ljalikov, K.K.Kalnish //J.Sci.and Appl.Photogr.and Cinematogr. 1965.V.31.No.8.P.1886 (in Russ.).
17. V.M.Treushnikov, A.M.Yanin, V.I.Tcherednik et al.// J.Sci.and Appl.Photogr.and Cinematogr. 1990.V.34.No.4.P.284 (in Russ.).
18. J.Barltrop, J.Coil. The excited states in organic chemistry (Russ. ed.).Moscow.Mir.1978.P.446. (in Russ.).
19. V.M.Treushnikov, A.M.Yesin, L.L.Pomerantseva et al.// J.Sci.and Appl.Photogr.and Cinematogr. 1990.V.34.No.2.P.119 (in Russ.).
20. V.M.Treushnikov, T.A.Zueva, A.M.Yesin et al.// J.Sci.and Appl.Photogr.and Cinematogr. 1990.V.34.No.3.P.167 (in Russ.).
21. N.M.Emanuel, A.L.Buchachenko. Chemical Physics of polymer agening and Stabilization.Moscow.Nauka.1982.P.360 (in Russ.).
22. N.M.Emanuel, A.L.Buchachenko. Chemical Physics of Molecular Destruction and Stabilization of Polymer.Moscow.Nauka.1988.P.368 (in Russ.).
23. E.Ya.Shlyapintokh. Photochemical transformations and stabilization of polymers. Moscow.Chimia.1979.P.344 (in Russ.).
24. V.M.Treushnikov, N.V.Zelentsova, A.V.Oleinik.// J.Sci.and Appl.Photogr.and Cinematogr. 1988.V.33.No.2.P.146 (in Russ.).
25. Kh.S. Bagdasarjan. Theory of the radical polymerization. Moscow. Nauka. 1966. P.300 (in Russ.).
26. Polymer Enciclopedia.Vol.1.Moscow.Soviet Enciclopedia.1977.P.300. (in Russ.).
27. O.N.Karpukhin, T.V.Pokholok, V.Ya.Shlyapintokh// Polymer Sci. A.1971.V.13. No.1. P.22. (in Russ.).
28. T.V.Pokholok, O.N.Karpukhin, V.Ya.Shlyapintokh// J.Polymer Sci. Chem. Ed. 1975.V.13. P.525. (in Russ.).
29. E.V.Bistritskaya, O.N.Karpukhin// Polymer Sci. A.1976.V.18. No.9. P.1963. (in Russ.).
30. A.N.Kuznetsov. Spin Probe Method. Moscow. Nauka. 1976. P.210. (in Russ.).
31. A.M.Wassermam, A.L.Kovarskii. Spin label and probe for physical chemistry of polymers. Moscow.Nauka.1986.P.246 (in Russ.).
32. V.M.Treushnikov, A.G.Babinkov, S.A.Yesin et al.// J.Sci.and Appl.Photogr.and Cinematogr. 1991.V.35.No.1.P.51 (in Russ.).
33. L.A.Faminskaya, V.A.Maslova, I.B.Rabinovitch// Proc. on Chemistry and Chemical Technology. N.Novgorod. 1975.P.71 (in Russ.).
34. A.G.Babinkov, V.A.Maslova, G.I.Busigina// Physical Chemistry Fundamentals in the Polymer Syntheses and Recycling . N.Novgorod. 1987.P.59 (in Russ.).
35. V.M.Treushnikov, N.V.Zelentsova, T.V.Kuz’mitcheva et al.// J.Sci.and Appl. Photogr. and Cinematogr. 1989.V.34. P.102 (in Russ.).
36. V.M.Treushnikov, A.M.Yanin, N.V.Zelentsova // J.Sci.and Appl.Photogr.and Cinematogr. 1988.V.33.No.1.P.25 (in Russ.).
37. A.M.Yanin, V.M.Treushnikov, L.N.Karyakina// High Energy Chemistry. 1988. V.22. No.2.P.142 (in Russ.).
38. F.H.Dill, W.P.Hornberger, P.S.Hangs et al// IEEE Trans.Electron Devices. 1975. V.ED-22. P.445.
39. T.Ohfuji, Yamanaka, M.Sakamoto// Proc. SPIE.1989.V.920.P.190.
40. V.M.Treushnikov, N.V.Zelentsova, A.V.Oleinik // J.Sci.and Appl.Photogr.and Cinematogr. 1989.V.34.No.3.P.165 (in Russ.).
41. V.M.Treushnikov, S.A.Yesin, N.A.Kuritsina et al // J.Sci.and Appl.Photogr.and Cinematogr. 1987.V.32.No.5.P.340 (in Russ.).
42. V.M.Treushnikov, S.A.Yesin, N.A.Kuritsina et al // J.Sci.and Appl.Photogr.and Cinematogr. 1987.V.32.No.6.P.409 (in Russ.).
43. S.A.Yesin, V.M.Treushnikov, T.A.Zueva // J.Sci.and Appl.Photogr.and Cinematogr. 1989.V.34.No.6.P.450 (in Russ.).
44. V.M.Treushnikov, A.M.Yanin, Yu.I.Koltsov // Electronic Technology. Ser.3. Microelectronics. 1991. No.1(140).P.26 (in Russ.).
45. V.M.Treushnikov // J.Sci.and Appl.Photogr.and Cinematogr. 1993.V.38.No.3.P.49 (in Russ.).
46. V.M.Treushnikov, A.M.Yanin, V.I.Tcherednik // J.Sci.and Appl.Photogr.and Cinematogr. 1993.V.38.No.4.P.22 (in Russ.).
47. V.M.Treushnikov, Yu.I.Koltsov// J.Sci.and Appl.Photogr.and Cinematogr. 1994.V.39.No.3.P. 9 (in Russ.).
48. V.M.Treushnikov, V.I.Tcherednik, A.V.Oleinik et al // J.Sci.and Appl.Photogr.and Cinematogr. 1994.V.39.No.3.P.1 (in Russ.).
49. A.A.Berlin, G.V.Korolev, T.Ya.Kefeli, Yu.M. Severgin// Acrylic oligomers and Materials on their basis. Moscow. Chimia. 1983. P.232. (in Russ.).
50. G.V.Korolev// The 1st All Union Conf. on Chemistry and Physical Chemistry of Polymerizable Oligomers. Tchernogolovka. DICP AS USSR. 1977. Vol.1. P.144. (in Russ.).
51. V.M.Treushnikov, T.A.Zueva, N.L.Gusarskaya et al // J.Sci.and Appl.Photogr.and Cinematogr. 1986.V.31.No.5.P.326 (in Russ.).
52. Yu.D.Semtchikov, S.F.Zhiltsov, V.N.Kaschaeva. Elements of Polymer Chemistry. Moscow. Bischaya Schkola.1989.P.24. (in Russ.).
53. Russian Pat. No. 2074673.
54. Russian Pat. No. 2052983.
55. USA Pat. No. 5725576.