| Site home page | Conference home page | Discussion |
ATP SYNTHESIS IN THE DISK MEMBRANES OF ROD OUTER SEGMENTS OF BOVINE RETINA.
I. M. Pepe1, L. Notari 2 , C. Cugnoli 3 , I. Panfoli2 , and A. Morelli2.
1 Istituto di Biofisica, Facolta’ di Medicina, 2 Istituto di Chimica Biologica,
Universita’ di Genova and 3 Istituto di Cibernetica e Biofisica del CNR, Genova, Italy.
Abstract: ATP is synthesized on the disk membrane isolated from rod outer segments of the bovine retina. Together with a slow component which accounted for a constant rate of about 22 nmoles ATP/min/mg of protein and which was due to the adenylate kinase activity, a fast component with a maximal activity of about 58 nmoles ATP/min/mg of protein was measured at physiological calcium concentrations. This fast activity disappeared in the presence of the Ca2+ ionophore A23187, was inhibited by vanadate or thapsigargin but not by oligomycin, suggesting that this ATP synthesis is due to the reversal functioning of the Ca2+ -ATPase previously found on the disk membranes.
Keywords: Ca2+ -ATPase; Photoreception; Vision energetics; Disk membranes; Bioenergetics
Correspondence address: I.M.Pepe, Institute of Biophysics, Faculty of Medicine, University of Genoa, Corso Europa 30, Genova 16132, Italy. Fax: +39 10 3538346, E-mail: pepe@ibf.unige.it
Abbreviations: ROS, Rod outer segment; SERCA, Sarco- or Endo-plasmic Reticulum Calcium ATPase ; DTT, dithiolthreitol; P-type ATPases, ATPases with phosphorylated intermediate.
1. INTRODUCTION
The electrical response to light of the photoreceptor cell involves an energy much greater than that transported by the absorbed photons. Early studies made on vertebrate retina by several authors found an increase of phosphate upon illumination associated with a decrease of high energy phosphate esters [1,2]. A decrease of ATP was reported in the rod outer segment (ROS) upon illumination [3]. The content of high energy phosphate esters available in the dark adapted rod outer segment of the frog retina was measured and corresponded to about 1.4 mM. This value decreased by about 60% in less than 12 sec after bleaching a few percent of the rhodopsin molecules [4].
The problem of availability of ATP in the rod outer segment during photoreception remains to be elucidated. It is well known that mitochondria are only present in the inner segment of the rod so that the ATP synthesized is thought to diffuse through the connecting cilium and reach the disks of the outer segment [5]. However, the reaction times involved in the photoreceptor cell functioning are shorter than those for the diffusion of ATP molecules, which should travel a particularly difficult path through the disk membranes and reach the apical disks of the ROS where the rhodopsin cascade works [6]. Infact, the average time for a small molecule such as cGMP to diffuse through the entire outer segment was estimated to be about six minutes by fluorescent probes [7], while the time involved in phototransduction reactions is of the order of milliseconds. Therefore, the synthesis of ATP is likely to happen on the ROS where the main reactions for the photoreception need an immediate source of energy. The finding that glyceraldehyde-3-phosphate dehydrogenase is present in large quantities in ROS suggests that part of the ATP and GTP synthesis in ROS takes place from glycolysis [8] which produces about 95 mM ATP / s [9]. The need of ATP in the rod outer segment is mainly due to the synthesis of cGMP. In the dark, a value of 28 mM ATP / s was obtained for the basal cGMP turnover [10]. Following illumination, the cost of synthesizing cGMP increases by a factor of 4.5 [10] reaching about 126 mM ATP / s, which is higher than the rate of ATP synthesized by glycolysis. Additional energy is also needed for supplying the GTP hydrolyzed by transducin and the ATP for rhodopsin phosphorylation. A system capable of maintaining a high local ATP/ADP ratio, based on creatine kinase and on diffusive metabolites such phosphocreatine and creatine, was shown to be present in bovine ROS [11]. However, the energy needed for phototransduction reactions such as the activation of transducin and the phosphorylation of rhodopsin, should be supplied within milliseconds. For this reason, the source of energy must be located on the disk membranes in order to avoid the slow diffusion of energy metabolites.
Disks are known to store calcium at millimolar levels [12] making a steep gradient with the cytoplasm where Ca2+ has a concentration of about 0.5 mM [13]. However, little is known about the ability of disk membranes to exchange Ca2+ with the cytoplasm and the significance of this in terms of photoreceptor function. A Ca2+ -ATPase was first localized by cytochemical studies on ROS disk membranes of the toad retina [14] and then isolated on polyacrylamide gel from bovine ROS disks [15]. Furthermore, it was characterized as a Sarco- or Endo-plasmic Reticulum Calcium ATPase (SERCA) type with a 100 kDa phosphorylated intermediate [16]. The ATP-dependent Ca2+- uptake showed a low affinity to calcium ions ( km for Ca2+ was estimated between 6 and 10 mM, see ref.4,6), suggesting a physiological role for the Ca2+ -ATPase different from that of pumping calcium into the disks.
This paper shows data suggesting that the Ca2+ -ATPase of the disks is able to reverse its function by acting as a synthesizer of ATP at the expense of the Ca2+ gradient. Infact, purified ROS disks, in the presence of ADP and phosphate, released calcium and synthesized ATP at the physiological range of Ca2+ concentrations present in ROS cytoplasm. These results are important in terms of the need of an immediate source of ATP on the disk membranes, where the energy is required to supply the rapid reactions of the photoreception processes.
2. EXPERIMENTAL
2.1. Osmotically intact disk preparations. ROS were isolated from 20 bovine retinae in dim red light by following the method of Schnetkamp and Daemen [18] by sucrose gradient centrifugation. Osmotically intact disks were obtained after bursting ROS for 3 h in 30 ml of 5% Ficoll (Sigma) in distilled water containing 5 mM DTT and 70 µg/ml leupeptin and then by collecting them in the light at the 5% Ficoll surface after centrifuging for 2 h at 25,000 rpm in a Beckman FW-27 rotor [19].
2.2. Ca2+-loading. Purified disk membranes were allowed to equilibrate overnight in a solution of 5 mM CaCl2 in distilled water containing 70 mg/ml leupeptin at 4°C. Prior to use, disks were rapidly washed with distilled water in order to eliminate external Ca2+.
2.3. ATP synthesis was measured on purified, washed and Ca2+ loaded disks, according to the method of Beil et al. [20] with minor modifications. Briefly, the reaction mixture contained: 40 mM Tris-Maleate pH 6.5, 120 mM KCl, 5 mM K2HPO4, 5 mM MgCl2, 1 mM ADP, 100 mM glucose, 0.05 mg/ml hexokinase and 1.2 mg of disk proteins were added to a final volume of 1 ml. Free Ca2+ concentrations of the mixture were obtained with a Ca2+-EGTA buffer [21] (EGTA was 2mM). Samples were kept at 37oC. At appropriate intervals, 0.1 ml aliquots of the reaction mixture were withdrawn and added to 120 ml of 25% perchloric acid. Samples were centrifuged for 15 min at 1,500 g, then 0.2 ml of supernatant were withdrawn and neutralized with K2CO3 and centrifuged again to remove potassium perchlorate; 0.1 ml aliquots were used for the assay of Glucose 6-phosphate.
2.4. Glucose 6-phosphate assay. Glucose 6-phosphate was assayed enzymatically. The medium contained 50 mM Tris-HCl, pH 8.0, 1 mM NADP and 10 mM MgCl2, 4 mg of purified Glucose 6-phosphate dehydrogenase. The rise in absorbance at 340 nm was followed spectrophotometrically.
Protein concentrations were determined using the Bradford method [22].
2.5. Measurements of Ca2+ efflux. Disks were charged overnight with 5 mM CaCl 2 and 25 mCi of 45Ca Cl2 in distilled water containing 70 mg/ml leupeptin at 4°C. Prior to use, disks were rapidly washed with distilled water in order to eliminate external Ca2+. Disk membranes (1.2 mg of protein) were added to 1 ml of the same reaction mixture used for the ATP synthesis measurements. Samples were kept at 37oC. At appropriate intervals, 0.1 ml aliquots of the reaction mixture were withdrawn and rapidly filtered through 0.45 mm pore size Millipore filters of mixed cellulose ester (HA type). The filters were then washed with 1 ml of 40 mM Tris-Maleate pH 6.5, 120 mM KCl, 10 mM MgCl2, 200 mM CaCl 2 and added to 10 ml of counting scintillant (Packard Pico-Fluor 40) and radioactivity was measured.
3. RESULTS AND DISCUSSION
In order to measure the ATP synthesized by the Ca2+-ATPase, isolated disk membranes charged with Ca2+ were added to a solution containing low calcium concentration, ADP, Pi , glucose and hexokinase (see Methods). These two latter compounds were added in order to transform the ATP produced, into glucose-6-phosphate so as to avoid the ATP accumulation and its subsequent hydrolysis. Therefore, the ATP synthesis was measured as glucose-6-phosphate production.
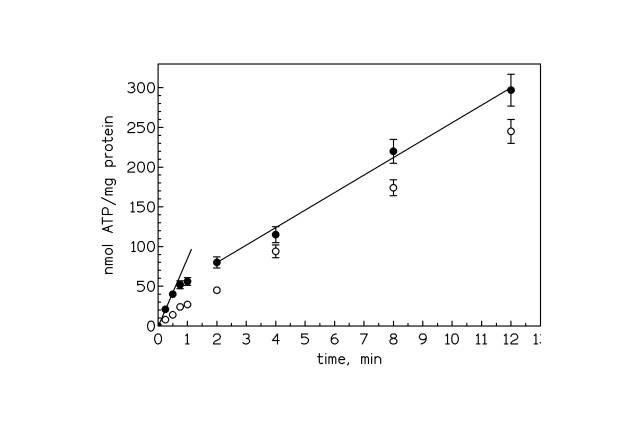
Figure 1. ATP synthesis in ROS disk membranes. The external free calcium concentration was about 1 mM ( l ). Thapsigargin (1.5 mM) or vanadate (10 mM) or Ca-ionophore A23187 ( O )were added to samples of disk membranes 20 min before the experiment was started. Each point represents the mean of triplicate measurements.
Fig. 1 shows the ATP synthesis in the disk membranes when the external concentration was about 1 mM. During the first half minute the ATP production increased linearly with a rate of about 80 ± 10 nmoles of ATPsynthesized /min / mg of protein. After about 1 min however, a smaller constant increase was observed. The slope of this plot gives a rate of ATP synthesis of about 22 ± 2 nmoles /min / mg of protein . This rate was decreased by increasing AMP concentration suggesting that the slow rate of ATP synthesis after long reaction times is due to the activity of an adenylate kinase. The addition of thapsigargin, which is known to inhibit most of SERCA pumps [23], and which actually inhibited the formation of the phosphorylated intermediate of the disk Ca-ATPase [16], inhibited the fast component of the ATP synthesis and had no effect on the slow component. Also vanadate, a well known inhibitor of P-type ATPases, had the same effect. The fast component of the ATP synthesis also disappeared in the presence of 5 μM calcium ionophore A23187. Instead, the addition of oligomycin, a potent inhibitor of F-ATPases like that of mitochondria, had no effect. The true rate of the Ca 2+ -driven ATP synthesis was obtained by subtracting the adenylate kinase from the initial fast rate. This gives an initial maximal rate of about 58 ± 12 nmoles /min / mg of protein followed by a decline presumably due to the decrease in the calcium gradient between the disk membranes and the external solution as it is shown later on Fig 3.
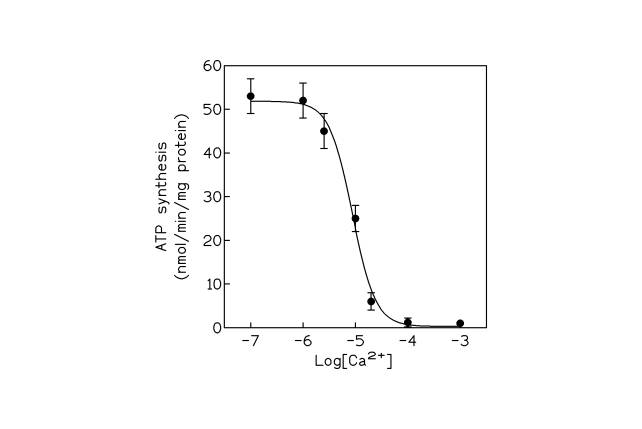
Figure 2. ATP synthesis in ROS disk membranes versus external free calcium concentrations. Each point represents the mean of triplicate measurements.
Fig 2 was obtained by plotting the Ca 2+- driven ATP synthesis in the isolated disk membranes versus the external calcium ion concentration. It can be easily seen that ATP is synthesized with a maximal activity in the range of calcium concentrations (10 -7 M ÷ 10 -6 M) which are actually present in the ROS cytoplasm during cell functioning. The experimental data fit a sigmoid curve from which a km for Ca2+ of about 10 mM can be calculated. This value is close to the value of 13 mM found for the ATP-dependent Ca 2+-uptake in the same preparation of disk membranes [15]. In the latter case however, the sigmoid curve of the Ca 2+-uptake was reversed with minimal activity in the range of Ca 2+ concentrations between 10 -7 and 10 -6 M [15].
In order to verify that the ATP synthesis is accomplished at the expense of the Ca2+ gradient between disk membranes and cytoplasm, disks were charged overnight with 5 mM CaCl 2 and 25 mCi of 45Ca2+ and the efflux of calcium ion was measured in the same experimental conditions as for the ATP synthesis measurements. Fig 3 shows that the calcium release from the disk membranes was enhanced in the presence of ADP at the external calcium ion concentration of 1mM.
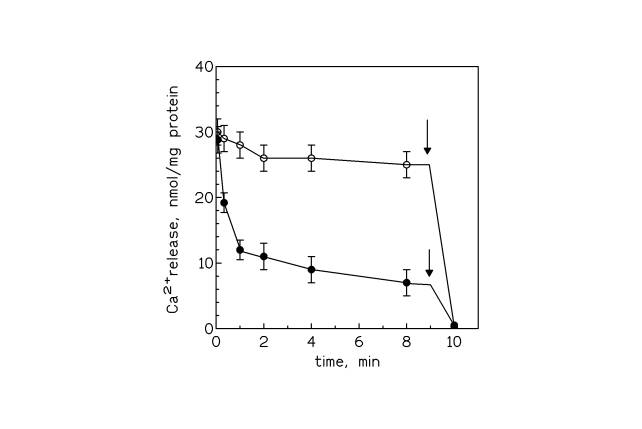
Figure 3. Activation of calcium release from disk membranes by ADP. Both curves refer to samples containing 1mM ADP, the curve made by unfilled circles refers to samples containing also 1.5 mM thapsigargin. The external free calcium concentration was about 1 mM. At the time indicated by the arrows, 5 mM calcium ionophore A23187 was added to the samples.
The control samples containing ADP and thapsigargin showed a low calcium leakage similar to that found in samples not containing ADP (data not shown). As can be deduced from Fig 3, the maximal rate of Ca2+ efflux, calculated during the first 20 s, had a value of about 30 nmoles/min/mg of protein, which is far from the stoichiometry of 2 moles of Ca2+ per 1 mole of ATP found for most of Ca2+ -ATPases [24,25]. This discrepancy could be due to an incomplete passive calcium loading of the disks which takes four days to reach the equilibrium [26]. After an overnight (12h) incubation instead, the calcium loading reaches a value of about half the value of 3 Ca2+ per rhodopsin reached in four days incubation [26]. Therefore, if the value of the Ca2+ efflux obtained from Fig 3 is multiplied by two, it results a Ca2+ /ATP stoichiometry approaching 1, which was found for some ATPases [14].
In conclusion, the fast component of the ATP synthesis measured on disk membranes was sensitive to vanadate, thapsigargin and Ca 2+-ionophore. Moreover, the synthesis of ATP was fully activated at physiological Ca2+ concentrations and it was accompanied by an efflux of Ca2+ , although with a Ca/ATP stoichiometry to be determined. These results suggest that, in normal physiological conditions, the Ca2+ -ATPase found on the disk membranes [14,15] is able to synthesize ATP at the expense of the calcium gradient between the disks and the cytoplasm of the rod outer segment. The reversal of the disk calcium pump produces ATP at a rate of about 58 nmol/min/mg of protein. This gives a result of about 110 mM ATP/s, assuming that rhodopsin (mw 39 kD) constitutes about 85 % of the total disk protein and is present in ROS at a concentration of 3 mM [27]. This value is not far from 126 mM ATP / s, which is required by the cGMP turnover following photoexcitation [10]. Although the latter could be accomplished by glycolysis [9], additional energy is also needed for supplying the GTP hydrolyzed by transducin and the ATP for rhodopsin phosphorylation, which are reactions located on the disk surface.
The advantage of the presence of an ATP synthase on the ROS disks follows from the fact that ATP is regenerated from ADP in situ directly on the disk membranes where the main reactions for the photoreception need an immediate source of energy. In this way, the slow diffusion (from seconds to minutes [28]) of energy metabolites or ATP molecules from ROS cytoplasm is avoided and phototransductive processes can rapidly (milliseconds) take place on the disk membrane.
ACKNOWLEDGMENTS: This work was supported by the MURST project “Bioenergetica e Trasporto di Membrana”.
REFERENCES
[1]. Auricchio, G., and De Berardinis, E. 1952, Ann. Opthal. 78, 53.
[2]. Dettmer, P. 1963, Biochemistry Symposium, Steinkopff, T. (Ed.), Dresden, 23.
[3]. Robinson, W.E., Yoshikami, S. and Hagins, W.A. 1974, Biophys. J., 15, 168a.
[4]. Caretta, A., and Cavaggioni, A. 1976, J. Physiol. Lond., 257, 687.
[5]. Biernbaum, M.S. and Bownds, M.D. 1985, J. Gen. Physiol., 85, 83.
[6]. Boesze-Battaglia, K., and Albert, A.D. 1990, J.Biol.Chem., 265, 20727.
[7]. Olson, A., and Pugh, E.N. 1993, Biophys. J., 65, 1335.
[8]. Hsu S-C.,and Molday, R.S. 1990, J. Biol. Chem., 265, 13308.
[9]. Hsu S-C.,and Molday, R.S. 1994, J. Biol. Chem., 269, 17954.
[10]. Ames, A., Walseth, T.F., Heyman, R.A., Barad, M., Graeff, R.M., and N.D. Goldberg, N.D. 1986, J. Biol. Chem., 261, 13034.
[11]. Hemmer, W., Riesinger, I., Wallimann, T., Eppenberger, H.M., and Quest, F.G. 1993, J.Cell Sci. 106, 671.
[12] Fain, G.L. and Schroder, W.H. (1985) J. Physiol. Lond. 368, 641-665.
[13] Gray-Keller, M. P. and Detwiler, P. B. (1994) Neuron 13,849-861.
[14] Davis, W.L., Hagler, H.K., Farmer, G.R., Martin, J.H., Bridges, G.(1988) Anat.Rec. 221 (3), 761-768.
[15] Panfoli, I., Morelli, A.and Pepe, I.M.(1994) J. Photochem. Photobiol. 24, 187-194.
[16] Panfoli, I. Morelli, A. and Pepe, I.M.(1994) Biochem. Biophys. Res. Commun. 204(2), 813-819.
[17] Puckett, K.L., Aronson, E.T. and Goldin, S.M. (1985) Biochemistry 24(2), 390-400.
[18] Schnetkamp, P.P M. and Daemen, F.J. (1982) Methods Enzymol. 81, 110-116.
[19] Smith, H.G., Stubbs, G.W. and Litman, B.J. (1985) Exp. Eye Res. 20, 211-217.
[20] Beil, F. U., von Chak, D. and Hasselbach, W. (1977) Eur. J. Biochem. 81,151-164.
[21] Fabiato, A. and Fabiato, F. (1979) J. Physiol. (Paris) 75, 463-505.
[22] Bradford, M. (1976) Anal. Biochem. 72, 248-254.
[23] Thastrup, O., Cullen, P.J., Drobak, B.K., Hanley, M.R., and Dawson, A.P. (1990) Proc.Natl.Acad.Sci. USA, 87, 2466-2473.
[24] Carafoli, E. (1991) Physiol. Rev. 71, 129-153
[25] Makinose, M. and Hasselbach, W. (1971) FEBS Lett. 12, 271-272.
[26] Bauer, P.J. (1988) J. Physiol. (London) 401, 309-327.
[27] Daemen, F.G.M. (1973) Biochim. Biophys. Acta, 300, 255-264.
[28] Olson, A. and Pugh, E.N. (1993) Biophys. J. 65, 1335-1352.
Figure legends
Figure 1. ATP synthesis in ROS disk membranes. The external free calcium concentration was about 1 mM ( l ). Thapsigargin (1.5 mM) or vanadate (10 mM) or Ca-ionophore A23187 ( O )were added to samples of disk membranes 20 min before the experiment was started. Each point represents the mean of triplicate measurements.
Figure 2. ATP synthesis in ROS disk membranes versus external free calcium concentrations. Each point represents the mean of triplicate measurements.
Figure 3. Activation of calcium release from disk membranes by ADP. Both curves refer to samples containing 1mM ADP, the curve made by unfilled circles refers to samples containing also 1.5 mM thapsigargin. The external free calcium concentration was about 1 mM. At the time indicated by the arrows, 5 mM calcium ionophore A23187 was added to the samples.