The ground state absorption spectrum of
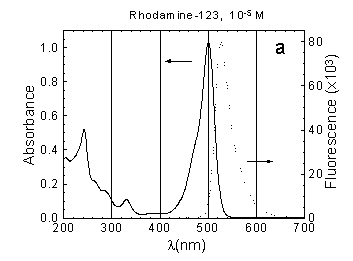
Rh-123 for the UV and visible spectral region is presented in Fig.1a.
The Rh-123 absorption spectrum in neutral aqueous solution consists of
an intensive band having a maximum around 500 nm, a shoulder at 475 nm
and less pronounced bands with maxima at 330 nm and 240 nm (Fig.1a). The
fluorescence spectrum of Rh-123 in buffer solution at neutral pH has a
maximum at 530 nm (Fig.1a), which is slightly shifted
when pH is varied.
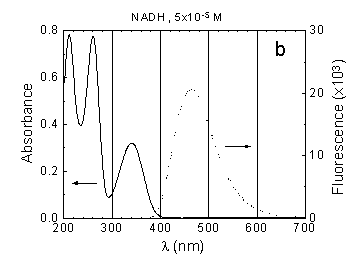
NADH in neutral aqueous solution is a
fluorescent biomolecule with absorption maxima around 340 nm and 260 nm
as well as with a broad emission band around 450 nm (Fig.1b).
Only reduced NADH is excited at 340 nm, whereas both reduced NADH and oxidized
NAD+ are excited at shorter wavelengths (excitation bands of
NAD+:
l<
260 nm). Fluorescence excited at 330-370 nm can be used to probe the excitation
energy relaxation in NADH molecules.
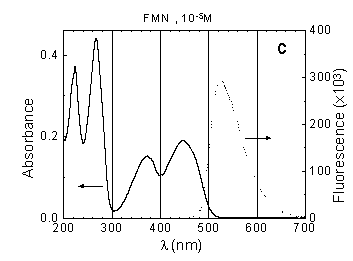
Flavin mononucleotide (FMN) absorbs light
in the UV and visible spectral region with maxima around 220, 270, 370
and 450 nm. Its emission maximum is about 513 nm (Fig.1c).
The difference absorption spectra of Rh-123,
NADH and FMN in aqueous solution under the excitation by 5 ps pulses of
the third harmonic (352 nm) of a Nd3+ glass laser are presented
in Figs. 2-4. The DA
spectrum of Rh-123 in aqueous solution exhibits a bleaching band with a
maximum around 500 nm (Fig.2). In comparison with
the absorption band of Rh-123, the bleaching band in the difference absorption
spectrum is wider and slightly red-shifted. It should be concluded that
the bleaching band of Rh-123 in aqueous solution reflects the depopulation
of its S0 state. This band is partially affected by the amplification
of emission in the red part of the spectrum. No transient absorption (DA
> 0) was detected in the visible part of the spectrum
from 400 to 800 nm, probably due to very low absorption cross section of
the excited state S1 of Rh-123 in aqueous solution. The lifetime
of relaxation of absorption bleaching at 500 nm in aqueous Rh-123 solution
is about 3.7 ns (Fig.5) and coincides with its fluorescence
lifetime.
Different DA
spectra were detected in aqueous solutions of NADH and FMN. Immediately
after excited state population of NADH in buffer solution at pH 7 following
352 nm excitation, the spectrum of DA
(shown in Fig.3) exhibits the transient absorptionin
the spectral region of 600-950 nm and the absorption bleaching at 450-600
nm. The wavelengths of absorption bleaching in the DA
spectrum approximately coincide with the fluorescence band of NADH. The
maximum of the bleaching band is red-shifted in comparison with the maximum
of NADH fluorescence (Fig.3). The transient absorption
in the spectral region of 600-950 nm does not reflect absorption from the
excited state S1 of NADH, since at the delay of 1.4 ns
between pump and probe pulse the transient absorption still remains, whereas
the bleaching band with the maximum of DA
around 500 nm disappears (due to a transition of excited molecules to the
ground state). Therefore, it appears that after excitation of NADH in aqueous
solution the formation of a transient species absorbing in the spectral
region of 500-900 nm takes place. This is supported by the kinetic measurements
shown in Fig.6. The relaxation time of the bleaching
band at 500 nm reflecting the relaxation of excited molecules to
the ground state is much shorter than transient absorption at 670 nm. It
seems that immediately after excitation of the S1 state
of NADH the formation of transient absorption in a wide region of the visible
spectrum occurs. It is impossible to assign this transient absorption to
absorption from the excited state of NADH molecules, since in this case,
the relaxation time at 500 nm and 670 nm should be the same. It is also
difficult to connect the transient absorption in the visible part of the
spectrum with the population of a triplet state of NADH, since the transient
absorption appears at the same time as the population of the S1
state (Fig.6). Therefore, it is more likely that immediately
after excitation of NADH by pulses of 5 picoseconds in aqueous solution
photoproducts (ionic species, aqueous electrons, etc.) or transient states
of NADH are detected. Since NADH in aqueous solution
is unstable and since the formation of oxidized NAD+ was
detected on illumination, the long-lived transient absorption might be
attributed to intermediate products appearing during NADH oxidation.
Figure 4 shows the
result of picosecond transient absorption measurements of FMN in aqueous
solution. The DA
spectra around 410-900 nm exhibit the bleaching bands around 440-480 nm
(characteristic of the ground state depopulation) and around 540-650
nm (coinciding with those of the fluorescence band of FMN). The bleaching
band at 540-650 nm indicates that the monitoring light pulse of the picosecond
continuum is slightly amplified by induced emission from the S1
state. On the other hand, the transient absorption at 480-540 nm and 640-900
nm (Fig.4) might be assigned to absorption by a transient
species immediately formed after excitation of FMN in aqueous solution
by picosecond light pulses. The decay detected at 500 nm and 750 nm was
different (Fig.7). The decay of transient absorption
of FMN cannot be fitted by a single-exponential function with a relaxation
time of 4.7 ns (the lifetime of fluorescence decay [9]), but can be approximated
by a biexponential function (the Levenberg-Marquardt iteration method)
with relaxation life times
t1
around 170 ps and t2
around 4.7 ns (l
= 500 nm). The transient absorption decay at 750 nm
(Fig. 7) cannot be fitted by a biexponential function.
The best approximation was achieved by a single-exponential function (relaxation
life time t
around 170 ps) and a plateau. Obviously, absorption changes around 500
nm and around 750 nm reflect different processes occurring after excitation
of FMN. The relaxation of transient absorption around 500 nm and decay
of absorption bleaching around 560 nm (t2
about 4.7) should be assigned to the singlet excited state lifetime which
is close to the fluorescence lifetime reported by Ref. [9]. The remaining
transient absorption plateau (Figs. 4,7) in the spectral region of 600
- 900 nm might be related to the long-lived photoproduct or transient state
of FMN after excitation by picosecond light pulses.
 back
back

Fig.1 Absorption (concentration as indicated) and fluorescence spectra (measured at concentration 10-6 M) of: (a) Rh-123, (b) NADH, (c) FMN in phosphate buffer solution, pH around 7.0, path length 10 mm.
 back
back
Fig.2. The absorption difference spectrum
of Rh-123, c=10-4 M, in PBS, path length 1 mm, excitation at
352 nm. Difference absorption spectra were measured at the time when the
pump and probe pulses are overlapping (Dt=0
ps); it reflects the maximum population of the excited molecular state
S1.
 back
back
Fig.3. Absorption difference spectra of
NADH, c=10-4 M, in PBS, path length 1 mm, excitation at 352
nm. The difference absorption spectra were measured at the time when the
pump and probe pulses are overlapping (Dt=0
ps) (it reflecting the maximum population of the excited molecular state
S1) and at the selected delay time Dt
between pump and probe pulses.
 back
back
Fig.4. Absorption difference spectra of
FMN, c=10-4 M, in PBS, path length 1 mm, excitation at 352 nm.
The difference absorption spectra were measured at the time when the pump
and probe pulses are overlapping (Dt=0
ps) (it reflecting the maximum population of the excited molecular state
S1) and at the selected delay time Dt
between pump and probe pulses.
 back
back
Fig.5. The absorbance kinetics of Rh-123
in PBS measured at 500 nm, excitation at 352 nm, path length 1 mm.
 back
back
Fig.6. The absorbance kinetics of NADH
in PBS, excitation at 352 nm, path length 1 mm.
 back
back
Fig.7. The absorbance kinetics of FMN
in PBS, excitation at 352 nm, path length 1 mm.